Chapter 15. Building the Help Desk Tabular Cube
We built a great application using LightSwitch that captures help desk tickets and groups them into queues. We deployed it to a server and wrote some T-SQL scripts to load in sample data from the Microsoft Adventure Works database. In this chapter, we will use Microsoft SQL Server 2012 PowerPivot for Microsoft Excel 2010 to build a tabular cube based on our LightSwitch-generated database. We will also source some additional data from the Windows Azure Marketplace DataMarket that we will use to enrich our model.
Just like developing in LightSwitch, using PowerPivot to develop our cube is a very iterative process and we will be using Excel pivot tables as a client to test our model and then switch back to PowerPivot to further refine the cube. This chapter will be heavily focused on building our cube in PowerPivot.
The prerequisites for this chapter are simple. You need Excel 2010 and the Microsoft SQL Server 2012 PowerPivot add-in installed and an account that has rights to access the SQL Server database containing our data. Let’s launch Excel and activate the PowerPivot ribbon. To learn how to enable the “Office Client Integration for PowerPivot” see Chapter 39.
Go ahead and launch the PowerPivot window, as shown in Figure 15-1.
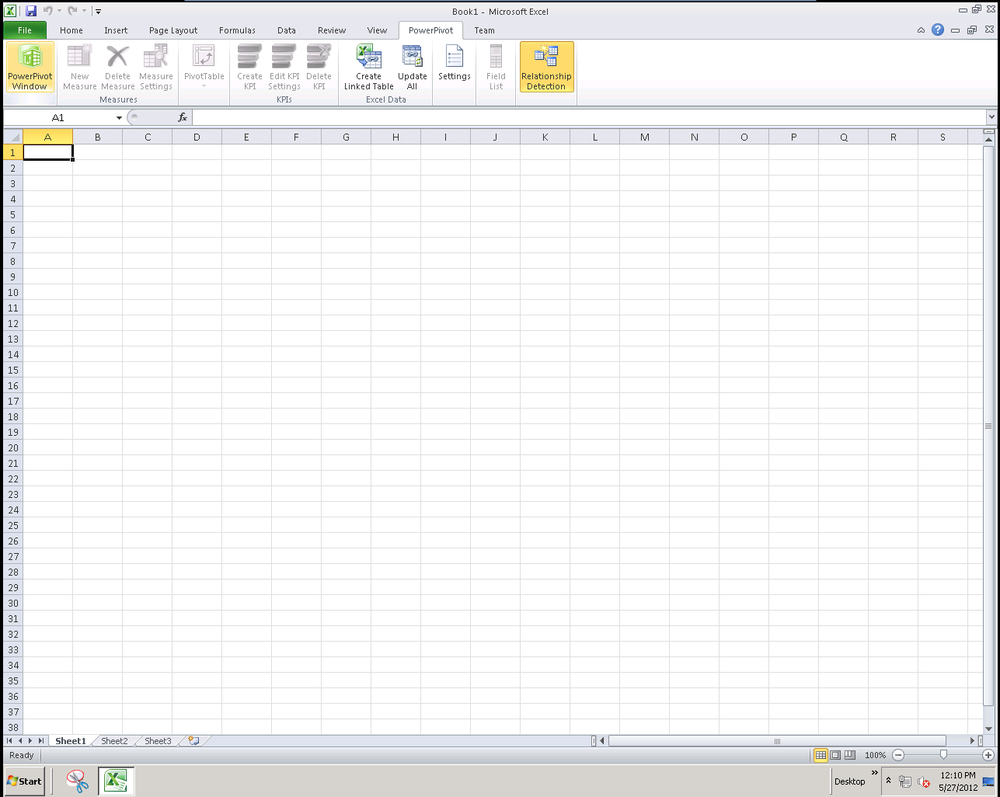
Figure 15-1. The PowerPivot tab in Excel
You’ll notice that a new window is launched for the PowerPivot for Excel ...
Get Developing Business Intelligence Apps for SharePoint now with the O’Reilly learning platform.
O’Reilly members experience books, live events, courses curated by job role, and more from O’Reilly and nearly 200 top publishers.

