DOES THE ALPHA REPAIR PROCESS WORK?
The process of alpha repair is tested by using this approach to create portfolios of stocks. First, the factors selected each month are used to create stock scores, which are taken as expected returns (aside from a linear transformation) for the stock portfolio construction process.
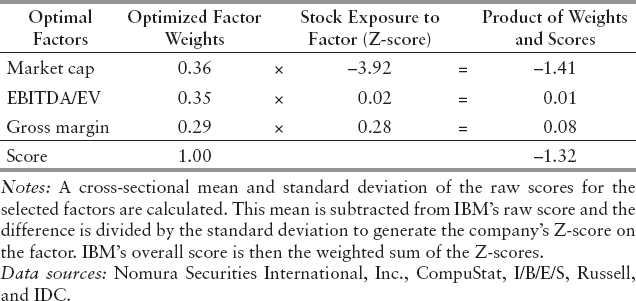
The scoring process for January 2007 is illustrated in Exhibit 15.7 using IBM. The three factors picked for January 2007 are market cap (Small – Big) at 35.6% weight, EBITDA/EV at 35.2% weight, and gross margin at 29.2% weight. Given the level of EBITDA/EV for every stock in the Russell 1000 on December 31, 2006, the Z-score is calculated (using the value of EBITDA/EV minus the average for the universe, divided by the standard deviation of the EBITDA/EV levels for the universe). That Z-score is multiplied by the weight for that factor, 0.35. Similar calculations for IBM are done for market cap and gross margin. The net score for IBM based on end-of-December data is −1.32, which is a below average score. The score for every stock in the Russell 1000 is calculated in this fashion, and that score is used as the measure of expected return for January.
EXHIBIT 15.7 Example of How Stocks Get Scored: IBM on December 31, 2006

EXHIBIT 15.8 Alpha Repair Portfolio Excess Returns over Russell 1000 (as of August 31, 2010)
Using the monthly scores, portfolios are constructed to ...
Get Equity Valuation and Portfolio Management now with the O’Reilly learning platform.
O’Reilly members experience books, live events, courses curated by job role, and more from O’Reilly and nearly 200 top publishers.

