Name
Chart → Chart Type
Synopsis
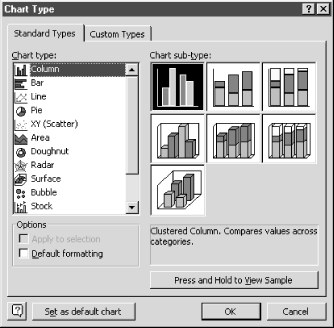
The Chart → Chart Type option allows you to change the chart type for the currently selected chart. The option also provides the ability to make the currently select chart type the default chart and to create a custom chart type. When you select this option, the Chart Type dialog displays, as shown in Figure 10-13. The currently selected chart type is indicated on the Chart Type dialog. For example, if you currently have one of the standard chart types selected, that chart and its sub-type will be selected on the Standard Types tab.

Figure 10-13. Chart Type dialog
Standard Types Tab
The Standard Types tab, shown in Figure 10-13, displays a list of several different chart types that can be selected in the Chart Type list box. When you select one of these types, a selection of sub-types display in the Chart sub-type section. If you want to preview how your data will look on your new chart selection, select the “Press and Hold to View Sample” button.
If you have made modifications to the formatting of the chart, you can have Excel resort back to the default formatting for the selected chart type by selecting the Default formatting option.
Custom Types Tab
The Custom Types tab, shown in Figure 10-14, displays a list of custom chart types that can be selected. These chart types are either ones that were included with Excel or ones that you have customized and ...
Get Excel 2000 in a Nutshell now with the O’Reilly learning platform.
O’Reilly members experience books, live events, courses curated by job role, and more from O’Reilly and nearly 200 top publishers.

