Chapter 9. In-Cell Charting Techniques
In This Chapter
Using the new data visualization conditional formatting options
Creating charts by using formulas and text characters
Creating sparklines by using tiny Excel charts
Identifying commercial add-ins for in-cell charting
This chapter describes some charting techniques that you may find useful. You'll find a variety of data visualization examples that go beyond traditional charting.
Visualizing Data with Conditional Formatting
Conditional formatting has improved significantly in Excel 2007, and it's now a useful tool for visualizing numeric data. In some cases, you may be able to use conditional formatting in lieu of a chart.
To apply a conditional formatting rule to a cell or range, select the cells and then use one of the commands on the Home
Note
This type of conditional formatting is new to Excel 2007, and it is not compatible with previous versions of Excel.
Figure 9-1 shows a few examples of conditional formatting that are relevant to visualizing data.
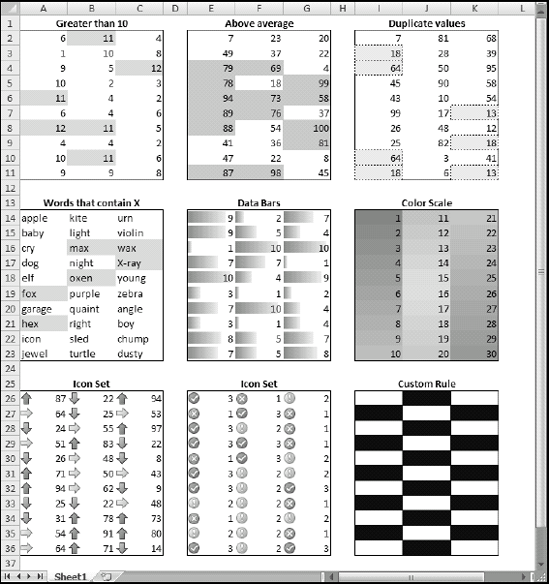
Figure 9-1. An overview of conditional formatting types useful for data visualization.
Data Bars
The data bars conditional format displays horizontal bars directly in a range of cells. By default, the length of the bar is based on the value in the cell relative to the other values in the range. ...
Get Excel® 2007 Charts now with the O’Reilly learning platform.
O’Reilly members experience books, live events, courses curated by job role, and more from O’Reilly and nearly 200 top publishers.

