7.3 Descriptive Statistics
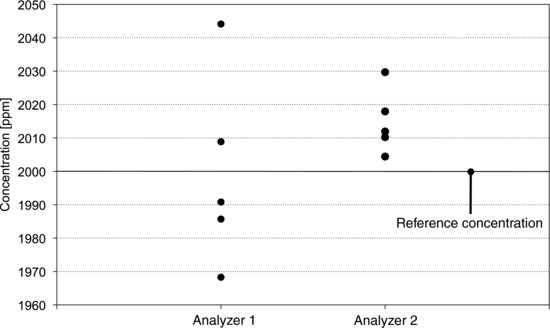
A gas analyzer is calibrated daily by using a reference gas with known concentration. During the calibration procedure, measurements of the reference concentration and the zero point are made repeatedly before calibration factors are determined. Figure 7.1 shows measurements of the reference concentration from two analyzers. With analyzer 1 the values are scattered over a wide range. As a group the values are centered on the reference concentration but they display a large variation around it. With analyzer 2 the situation is reversed. The variation between the measurements is small but the centering is poor. In statistical terms we would describe these analyzers in terms of their accuracies and precisions. We would say that analyzer 1 has good accuracy but poor precision. Analyzer 2 has good precision, but the accuracy is poor. These terms are often used in connection with measurement data, so make sure to memorize that precision describes variation, while accuracy describes centering. In this section, some measures of variation and centering are presented.
Figure 7.1 Readings from two gas analyzers during calibration. Left: Analyzer 1 has good accuracy and poor precision. Right: Analyzer 2 has poor accuracy and good precision.
When we have measured something we often want to get a quick impression of the result. Methods for summarizing the essential ...
Get Experiment!: Planning, Implementing and Interpreting now with the O’Reilly learning platform.
O’Reilly members experience books, live events, courses curated by job role, and more from O’Reilly and nearly 200 top publishers.

