ADDING THE DETAIL OF PRICE PATTERNS TO STRENGTHEN THE MESSAGE
Throughout this book, I have emphasized the importance of price patterns. Price patterns enhance the probability that the signals generated from the market timing charts presented previously will actually be validated.
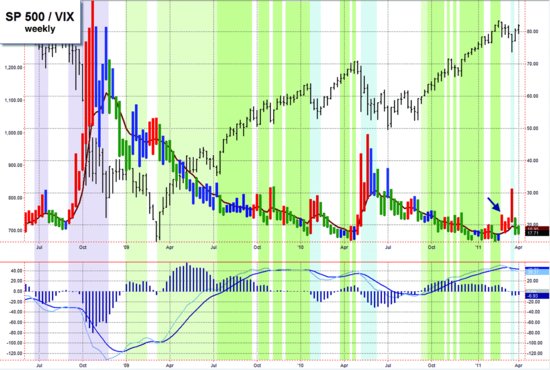
For instance, during the correction in February–March 2011 (at the far right of the chart in Figure 7.8), we see that the market for the week of 2/20/11 entered a transition period (indicated by the blue arrow). The VIX was flashing red bars, signaling to sell.
FIGURE 7.8 The Weathervane showing color-coded seasons.
$INX and the VIX (Volatility Index), weekly. MACD (12, 26, 9), Impulse system applied to the VIX with colors reversed.

At this same time, on the daily chart (Figure 7.9), we witness a sell signal from a bearish MACD crossover (A), followed by a price close below the 20-day EMA (B). Prices were confirming the warning given by the red VIX Impulse bars on the Weathervane.
FIGURE 7.9 Daily prices are beginning to weaken.
$INX, daily, indicator set #16. A sell signal develops: • A sell alert is given by a bearish MACD crossover (A). • A sell signal is triggered by a subsequent price close below the 20-day EMA (B).

When we zoom in and focus a little (Figure 7.10), we see more pattern support, ...
Get Fly Fishing the Stock Market: How to Search for, Catch, and Net the Market's Best Trades now with the O’Reilly learning platform.
O’Reilly members experience books, live events, courses curated by job role, and more from O’Reilly and nearly 200 top publishers.

