GLF TRADE
A good example of losing perspective due to exuberance was my GLF trade (Figures 13.1 through 13.3 ), which did not go well for me. However, I learned many things from the interaction of longs who were panic selling, shorts who were covering, and new buyers who were jumping in with both feet.
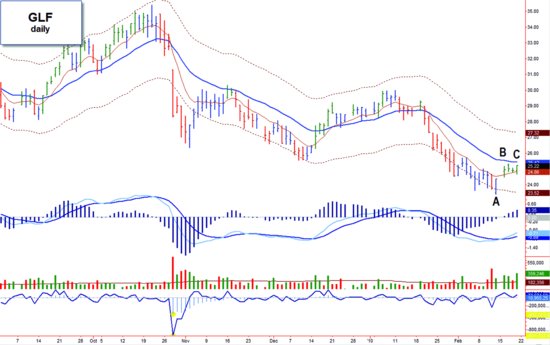
Figure 13.1 Struggling to stay in the value zone.
GLF, daily, indicator set #8. Characteristics of the trade set-up: • False downside breakout. Impulse changed from red to blue, accompanied by a bullish MACD crossover (bar A). • Gap into the value zone, changing the Impulse color to green (bar B). • Four days of consolidation ensued (B–C). • Bullish engulfing bar closed at the high of the day on strong volume (bar C).

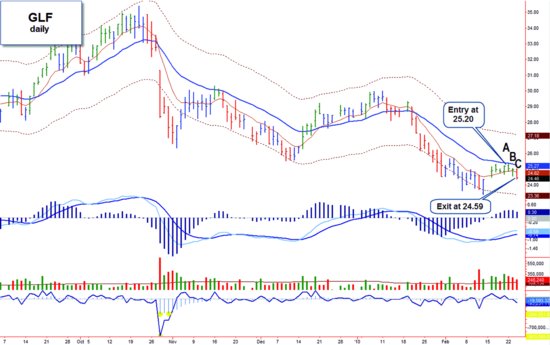
Figure 13.2 Rollover and retest.
GLF, daily, indicator set #8. Progress of the trade: • Stock opens and takes out the previous day’s high (bar A). I was filled at 25.20. • Prices fall out but recover the value zone at the end of the day (bar B). • Prices open and deteriorate, dropping to a new weekly low and changing the Impulse from green to red (bar C). I was stopped out at 24.59, for a 2.4 percent loss over three days.

Figure 13.3 Huge reversal bar.
GLF, daily, indicator set #8. Sequence of events following the earnings announcement: • Stock gaps ...
Get Fly Fishing the Stock Market: How to Search for, Catch, and Net the Market's Best Trades now with the O’Reilly learning platform.
O’Reilly members experience books, live events, courses curated by job role, and more from O’Reilly and nearly 200 top publishers.

