Chapter 3
The Truth about Trendlines
Trading stocks using chart patterns is a lot like fishing—patiently waiting for a chart pattern to appear and excitement when the chase begins. If you're lucky, the sweetness of success will overcome the bitter taste of failure. You will have both, but trendlines can help.
Trendlines are overlooked chart patterns, but serve as wonderful tools to help gauge where price is going. They are the logical choice to begin our exploration of chart patterns.
What Are Trendlines?
If you look at almost any price chart, your eyes will find prices that zigzag but still follow an imaginary path. That path is called a trend. If you draw a line connecting the peaks or valleys along that trend, you get a trendline. A trendline can outline a chart pattern as we will see in Figure 3.1 (the falling wedge), or it can highlight a price trend (trendline C). Trendlines indicate buying or selling opportunities when price crosses them.
- When price trends, a line connecting them is called a trendline.
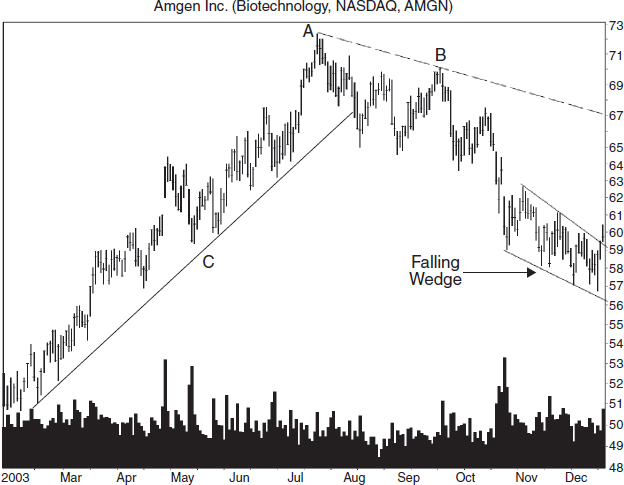
FIGURE 3.1 A falling wedge with an upward breakout marked a buying opportunity until a trendline, drawn along the tops connecting points A and B and extended down, warned that price might stall when it reached the trendline.
A Trendline Example
Figure 3.1 shows examples of several trendlines. Trendline C is a good example of a trendline. Price touches the line multiple ...
Get Getting Started in Chart Patterns, 2nd Edition now with the O’Reilly learning platform.
O’Reilly members experience books, live events, courses curated by job role, and more from O’Reilly and nearly 200 top publishers.

