December 2011
Beginner to intermediate
448 pages
11h 44m
English
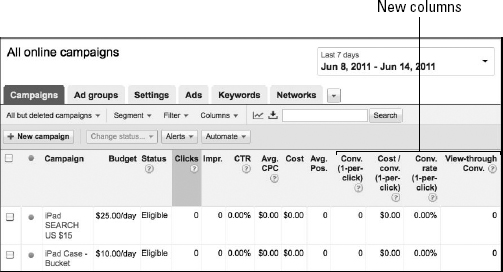
After you trigger conversion tracking by generating the code snippet, Google shows you four new columns (as shown in Figure 6-4) on the campaign management pages: Conv. (conversions), Cost/Conv. (cost per conversion), Conv. Rate (conversion rate), and View-through Conv. We're not going to talk about View-through Conversions, but instead focus on the other three.
These columns also appear at the ad group, keyword, placement, and ad levels, so you can see the effectiveness of every unit of your AdWords account. Until you place the conversion code on your site and visitors start converting, you will see zeroes in those columns. Also, expect a 24-hour delay in reporting a conversion.
Figure 6-4: New columns appear after you initiate conversion tracking.
These columns tell you how many conversions were generated by the element in that row: campaign, ad group, keyword, placement, or ad. In Figure 6-5, we show a client account of ours (http://continuingedexpress.com; they provide ongoing real estate education) to show you what your account will look like when you start generating conversions. You can see four ad groups in the campaign, all of which have led to conversions. The Continuing Ed Express ad group generated 64 1-per-click conversions.
Figure 6-5: Conversion statistics help you calculate the ROI of your ad groups.
“1-per-click” refers ...
Read now
Unlock full access


 O’Reilly covers everything we've got, with content to help us build a world-class technology community, upgrade the capabilities and competencies of our teams, and improve overall team performance as well as their engagement.I wanted to learn C and C++, but it didn't click for me until I picked up an O'Reilly book. When I went on the O’Reilly platform, I was astonished to find all the books there, plus live events and sandboxes so you could play around with the technology.I’ve been on the O’Reilly platform for more than eight years. I use a couple of learning platforms, but I'm on O'Reilly more than anybody else. When you're there, you start learning. I'm never disappointed.I'm always learning. So when I got on to O'Reilly, I was like a kid in a candy store. There are playlists. There are answers. There's on-demand training. It's worth its weight in gold, in terms of what it allows me to do.