Chapter 2. Setting Up Your Development Environment
When developing a UI in Google Script, you will often load the UI in a browser to see how code is rendered on the page. The GUI builder will certainly help you see a draft of your UI, but it does not load the live data. Among the several ways of displaying the UI during development, it is best to use the standalone web page. The reason for this is that each time a change is made in the script, proofing that change only requires reloading the UI published page.
The Script Editor has a built-in debugger that can help when you are working up the processing elements. For example, you would like to retrieve some data from a SOAP service and parse the XML. The debugger will allow you to set break points so you can step through the code and review values throughout the process.
Once you start using interactive elements in the UI like a click handler, you will not be able to use the debugger. This is because the frontend of the UI is loaded into the browser and therefore independent of the Script Editor. Later in this chapter, we will introduce an error catching method that will help you find problems in your code.
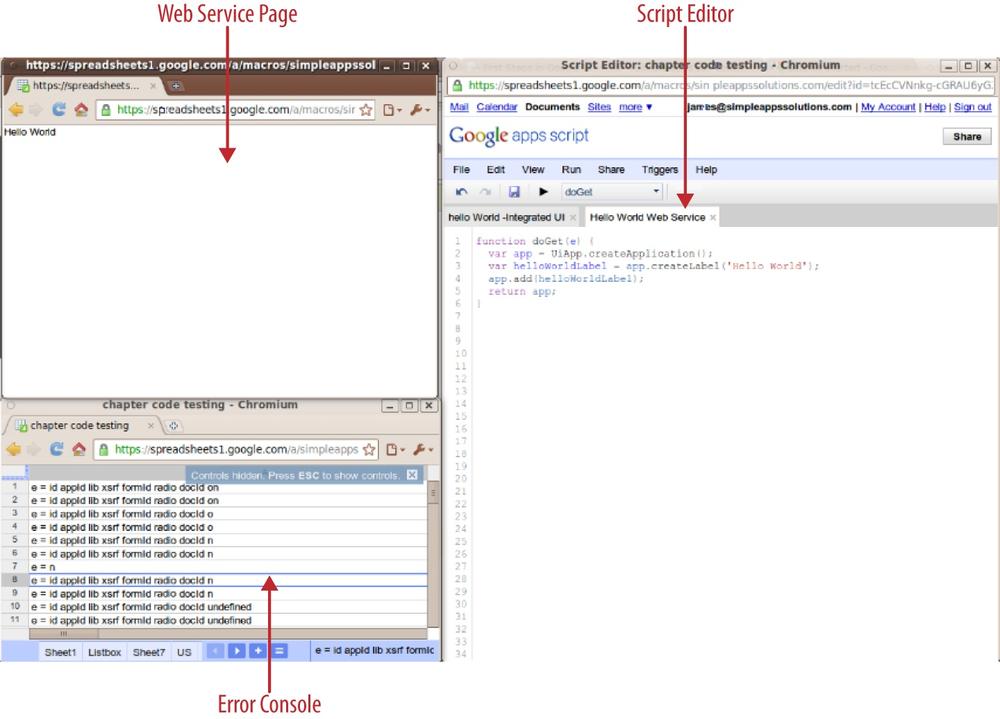
Most developers like to have an arrangement of code, live view, and console output like what you have in the Eclipse IDE. Figure 2-1 shows a layout of three browser windows that effectively create an IDE look for Google Script.

Get Google Script: Enterprise Application Essentials now with the O’Reilly learning platform.
O’Reilly members experience books, live events, courses curated by job role, and more from O’Reilly and nearly 200 top publishers.

