Immunity Debugger 101
Let's take a quick tour of Immunity Debugger and its interface before digging into immlib, the Python library that enables you to script the debugger. When you first open Immunity Debugger you should see the interface shown in Figure 5-1.
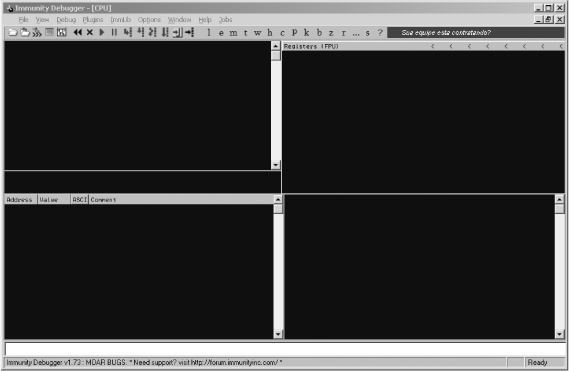
Figure 5-1. Immunity Debugger main interface
The main debugger interface is divided into five primary sections. The top left is the CPU pane, where the assembly code of the process is displayed. The top right is the registers pane, where all of the general-purpose registers and other CPU registers are displayed. The bottom left is the memory dump pane, where you can see hexadecimal dumps of ...
Get Gray Hat Python now with the O’Reilly learning platform.
O’Reilly members experience books, live events, courses curated by job role, and more from O’Reilly and nearly 200 top publishers.

