Chapter 4. Data and Distribution
In the previous chapter, you saw how to design a minimum viable product (MVP) around your startup ideas. In this chapter, we’re going to look at how to grow the MVP using data and distribution.
Data is how you take a bunch of assumptions and guesses and turn them into concrete, actionable facts. I’ll describe why measuring is almost always better than not measuring, introduce a list of the metrics you should be tracking at every startup, and explain how to use those metrics to make better decisions using data-driven development.
Distribution is how users find your product. It doesn’t matter if you’ve created an incredible product if no one actually knows it exists. I’ll review the most common distribution strategies used by startups, including word of mouth, marketing, sales, and branding.
Data
It’s the product manager’s job to articulate two simple things:
What game are we playing?
How do we keep score?
Do these two things right, and all of a sudden a collection of brilliant individual contributors with talents in engineering, operations, quality, design, and marketing will start running in the same direction. Without it, no amount of prioritization or execution management will save you.
[Nash 2011], Adam Nash, President and CEO at Wealthfront
If you want to build a successful product, you have to know what game you’re playing and how to keep score. For a company, the “game” is just another way of saying “mission,” which I will discuss later in the book in “Core Ideology”. In this chapter, I’m going to focus on how to keep score. Although there are times when the only meaningful gauge of progress is gut feel—such as observing how happy users are in a usability study—a better way to keep score in most situations is by gathering and analyzing data.
One of the strengths of modern software startups is that it is very easy to collect data on every aspect of your business. Using tools like Google Analytics, KISSmetrics, and New Relic (see “Monitoring” for the full list), you can track where users are coming from, how they are using your product, which features are generating the most revenue, what parts of your tech stack have the best performance, and so on. Instead of blindly guessing, you can use this data to make informed decisions about what products to build, what distribution channels to use, and how to evolve your technology. Making good use of data for decision making is largely a game of measurement:
Measurement: a quantitatively expressed reduction of uncertainty based on one or more observations.
[Hubbard 2010, 23], Douglas W. Hubbard, How to Measure Anything
Notice that the definition of measurement is not about eliminating uncertainty but merely reducing it. You can never completely eliminate uncertainty. Nothing in business, or anywhere in life, is ever completely certain, and no measurement is perfect. But just because the measurement is not exact or there is still some doubt does not mean that it is worthless. Imperfect measurements are typically better than doing no measurement and going with your opinion—even if it’s an expert opinion. Researchers at the University of Michigan have compiled hundreds of studies that show that basic measurement and quantitative analysis routinely outperforms human experts:
In predicting college freshman GPAs, a simple linear model of high school rank and aptitude tests outperformed experienced admissions staff.
In predicting the recidivism of criminals, criminal records and prison records outperformed criminologists.
The academic performance of medical school students was better predicted with simple models based on past academic performance than with interviews with professors.
In a World War II study of predictions of how well Navy recruits would perform in boot camp, models based on high school records and aptitude tests outperformed expert interviewers. Even when the interviewers were given the same data, the predictions of performance were best when the expert opinions were ignored.
[Hubbard 2010, 225], Douglas W. Hubbard, How to Measure Anything
Human beings, even experts, are wrong very, very frequently. Data and measurement are some of the best tools for getting things right. If you’re not an expert on data analysis, don’t worry. For most of the things you need to measure in a startup, you don’t need sophisticated tools or methods. Your goal is not to be published in a scientific journal but to gather data that increases the odds that you’re making good decisions. To do that, simple, imperfect methods are usually good enough.
Moreover, as is a common theme in this book, measurement is an iterative process. You don’t have to set up the perfect tracking and analytics system from day one. You don’t have to measure everything to get value out of measuring. In fact, you usually get the most bang for the buck off of the initial few measurements, and then diminishing returns with more and more elaborate methods. Start small, perhaps by tracking just a single metric (see “The magic number”), and then gradually evolve your approach to measure more and more.
Of course, not everything that can be measured should be measured. For each type of data X, ask yourself two questions:
-
If I could measure X, is there at least one concrete decision it would affect?
-
Is that decision worth more than the cost to measure X?
If you can’t answer “yes” to both questions, then it’s not worth measuring X. That said, most people are surprised by what can be measured with minimal cost and effort. The book How to Measure Anything shows how to quantify a variety of concepts, including ones that seem fuzzy and unmeasurable, such as product quality, brand perception, security, and risk [Hubbard 2010].
Anything can be measured. If a thing can be observed in any way at all, it lends itself to some type of measurement method. No matter how “fuzzy” the measurement is, it’s still a measurement if it tells you more than you knew before. And those very things most likely to be seen as immeasurable are, virtually always, solved by relatively simple measurement methods.
[Hubbard 2010, 3], Douglas W. Hubbard, How to Measure Anything
Let’s take a look at some metrics that you’ll want to track at almost every startup.
What metrics to track
The numbers that matter to a startup will vary from company to company, but there are several types of metrics that just about everyone will need to track:
-
Acquisition
-
Activation
-
Retention
-
Referral
-
Revenue
-
The magic number
The first five metrics—acquisition, activation, retention, referral, and revenue—come from Dave McClure’s “Startup Metrics for Pirates,” and are easy to remember by the acronym AARRR [McClure 2007].1 The last metric, the magic number, is derived from the first five, and it’s a great way to get a global view of how your startup is doing.
Acquisition
The first metric you should care about is acquisition, or how users find your product. As I’ll discuss in “Distribution”, it doesn’t matter how great your product is if no one can find it. To help people find it, you can use distribution channels such as search engines, advertising, blogs, email, TV, and social networks. Because acquisition is the top of the funnel, it’s the first and often the toughest bottleneck for growth. The only way to make it work is to try many different experiments across many different acquisition channels and to carefully track which ones are working and which ones aren’t.
Activation
Once users have found your product, the next thing to track is activation, which is a measure of how many users engage with your product by signing up for an account, inviting a friend, performing a search, or making a purchase. If you have the wrong messaging, your design doesn’t make it obvious what the user needs to do, or if your acquisition channel is bringing in the wrong audience, the user might bounce, or leave the product immediately after seeing it, without performing any actions.
In general, as you make your product better and improve your acquisition targeting, the activation rate should go up and the bounce rate should go down. This is one area where you can do heavy A/B testing (which we’ll discuss in “Data-driven development”) to improve your numbers. Also, make sure to break down the activation numbers by acquisition channel to see if certain channels are leading to higher activation rates than others. Perhaps users who come in through Facebook ads have an 80% bounce rate, while users who come in through Google search have only a 50% bounce rate. If so, you know you need to tweak your ad targeting on Facebook or stop using ads entirely and double down on improving your search ranking.
Retention
The next stage is getting activated users to come back and use your product again. In some ways, this is also acquisition, but retention typically uses different channels and therefore should be tracked separately. Most users have lots of things fighting for their attention, so they will not remember to keep using your app or come back to your website unless you go out of your way to remind them. This is why almost everyone wants you to sign up for their email newsletter, why every company maintains a blog full of useful tips and advice, why every mobile app wants to send you notifications, and why many games have time-based features that require you to keep coming back so you don’t lose progress. Even users that have activated still need to see a product many times before it sticks and becomes a part of their routine.
You’ll want to track how many of your visitors return after a week, a month, and a year. And just as some of your acquisition channels will work better than others, you’ll want to track which of your retention channels is most effective at getting users to come back. Finally, make sure to break the retention numbers down across activation and acquisition dimensions. For example, if you’re building a product with social features, you might find that retention is higher among users who were invited by a friend than users who came in as a cold sign-up. This is why most social applications make such an effort to get you to invite your friends and to connect with users during the initial activation flow.
Referral
The topic of inviting friends brings us to referral metrics. In a sense, this is also another form of acquisition, but one that’s focused on one specific channel: existing users of your product helping you acquire new users. It’s worth calling out separately because just about every product in the world, no matter what other distribution channels it uses, still relies heavily on word of mouth (see “Word of mouth”). This is why many companies offer rewards for referring your friends, such as DropBox offering 500MB of free storage space for each friend you get to sign up.
Referral metrics are not only important as a source of acquisition, but also as a proxy for measuring the quality of your product. You wouldn’t recommend a product to your friend unless you liked it, so referrals going up is often a great way to measure that your product is getting better. This is why knowing where referrals came from is essential, and why “how did you hear about us?” is a very common question on registration forms.
Revenue
You should be tracking how much money you’re making and what channels it’s coming through, such as sales, subscriptions, ads, or biz dev. You will probably want to use your revenue numbers to calculate the customer lifetime value (CLV), which is an estimate of how much money you’ll make from a single customer over the lifetime of your relationship with them (if you Google around, you can find a number of simple formulas for calculating CLV). For a business to be successful, your CLV must be greater than your acquisition costs, so track these two metrics carefully.
Also, don’t forget to break down your revenue numbers across the other metrics. For example, if you look at mobile games produced by companies like Zynga, you’ll find that half of the revenue comes from just 0.15% of the players. These players are known as “whales” and understanding what acquisition, activation, retention, and referral strategies attract more whales is the only way to succeed in such a business [Johnson 2014].
The magic number
Every company has a “magic number”: some metric that, when the user crosses it, they have an “a-ha” moment and finally “get” the product. For example, for Facebook, the leading indicator that a new user will become a highly engaged user is the magic number of connecting with 7 friends within 10 days of registering [Palihapitiya 2013]. At Twitter, a new user is likely to become an active user once they follow 30 people [Elman 2011]. At Slack, once a team exchanges 2,000 messages, 93% of them remain Slack users [First Round Review 2015]. Identifying a magic number allows your team to focus on a single clear, concrete, easily measurable goal, which simplifies decision making across the company. Will this project significantly affect our magic number? If yes, let’s do it. If not, shelve it for later.
Andrew Chen posted a great guide on Quora on how to identify the magic number for your company [Chen 2013]. The first step is to figure out what the success metric is for your company. When the success metric is going up, your business is succeeding, and when it’s going down, your business is failing. This will vary for every company, but it should be pretty obvious. Facebook and Twitter get most of their revenue from ads, so their success metrics are very closely tied to user engagement (e.g., how many times the user comes back to the site over a 28-day period). Slack is a subscriptions product, so its success might be tied to what percentage of users are paying customers. Etsy is an e-commerce company, so its success metric is probably tied to how many transactions happen on the site.
Once you’ve figured out the success metric, the second step is to determine which user actions correlate with an increase in your success metric. Grab a representative subset of your users and plug all the data you have on them (e.g., the acquisition metrics, activation metrics, etc.) into a giant spreadsheet. Once you plot the user activity metrics against your company’s success metric, you’ll sometimes get lucky and find a very obvious correlation. For example, if you plot the number of people a Twitter user is following versus the number of consecutive days they log in, you get the graph in Figure 4-1, and it’s obvious that the tipping point is around 30–40 on the y-axis. Sometimes it’s not as obvious, and you’ll have to run a regression to find a good correlation.2
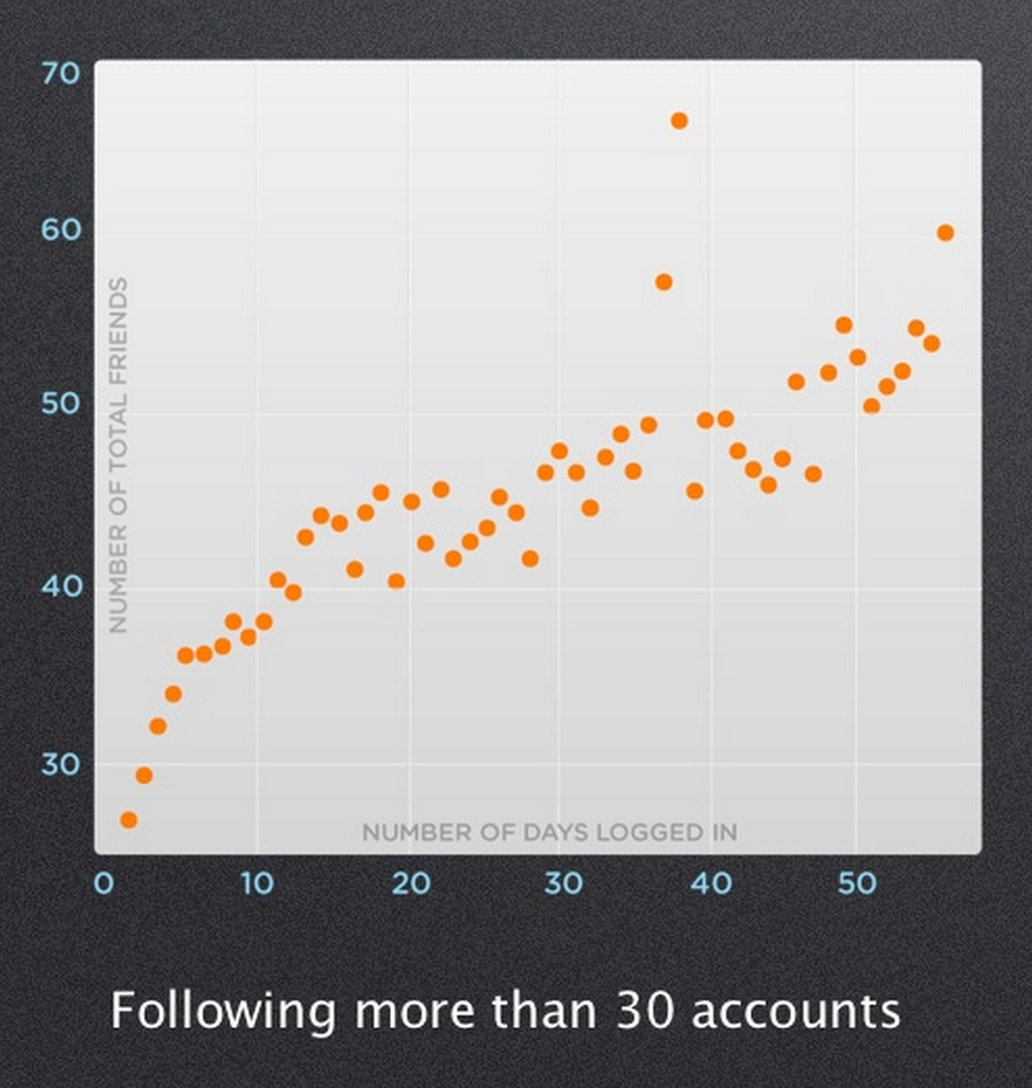
Figure 4-1. Number of people a Twitter user is following versus how many days in a row they log in [Elman 2011]
You don’t need to find a perfect correlation and you don’t want to define your magic number as a collection of 25 different factors. Your magic number needs to be inspiring and easy to reason about, so prefer a metric that’s simple and explains most of the variation to one that explains a little more of the variation but at the expense of significantly more complexity. Whatever metric you select as your magic number, the final step is to test it and make sure that it affects your success metric the way you expect. In other words, you need to show cause and effect rather than just correlation, which is usually best done through A/B testing, a key part of data-driven development.
Data-driven development
The first time you start gathering metrics about your business is an eye-opening experience. Even if all you do is hook up Google Analytics to your website, it’s remarkable to see how many people visited, what pages they looked at, where they came from, and so on. After staring at the data for a while, you’ll begin to wonder which of the products and features you built were successful and how you could use data to increase your odds of success. This is where data-driven development comes into play.
There are many aspects to data-driven development, but the one you’re going to use the most often is called A/B testing. An A/B test is marketing jargon for a controlled experiment where the subjects are randomly divided into two groups, an “A” group and a “B” group, with all variables kept the same between the two groups except for one independent variable. This allows you to try two different values of the independent variable, one in each group, and see if it has any statistically meaningful effect on that group’s behavior. Of course, you could also test more than two values of the independent variable, but then you have to switch to different marketing jargon called split testing or bucket testing, where instead of two groups, you divide users into many groups (or “buckets”) and test a different value of the independent variable on each one.
For example, around 2009, LinkedIn was working on a new design for the subscriptions page, where users could sign up for a premium account. The design called for a large image of a happy person right at the top. But what person should we use? We could have let the designer choose it based on gut feel, but we decided to bucket test it. We had four stock photos to choose from, so we randomly divided LinkedIn members into four buckets, buckets A, B, C, and D, and showed each user one of the images in Figure 4-2. Which bucket do you think performed the best?
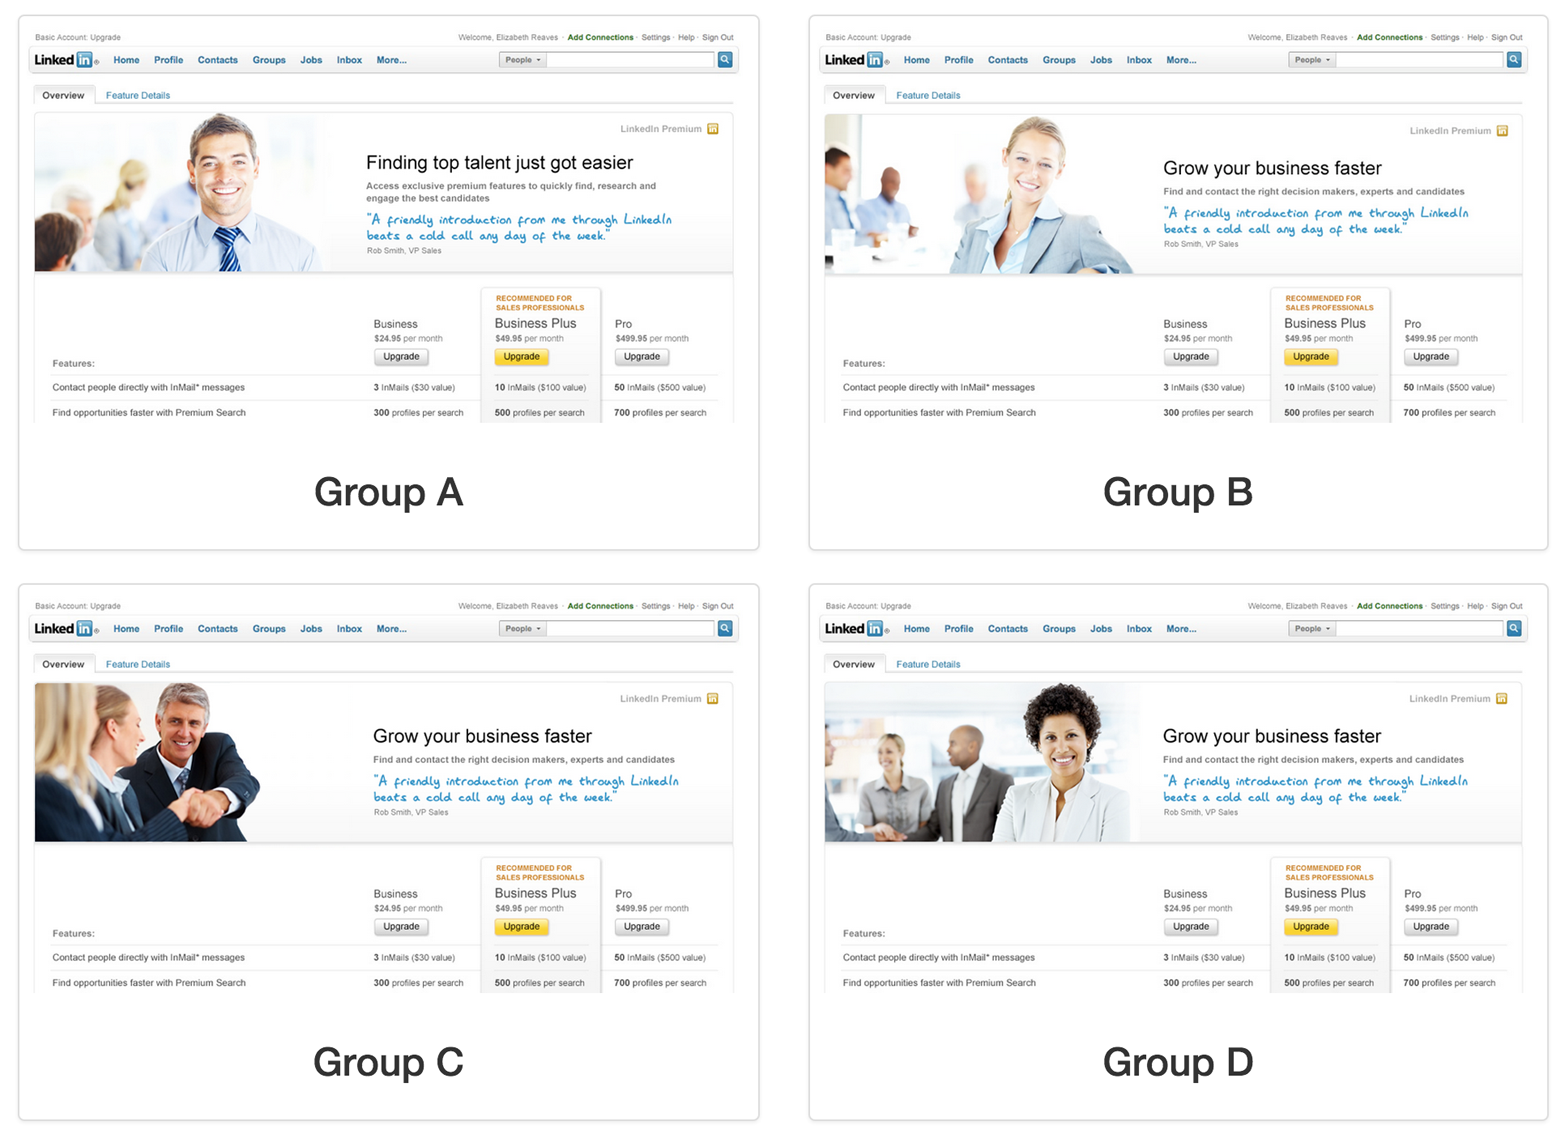
Figure 4-2. LinkedIn subscriptions bucket test
It turns out that bucket C significantly outperformed the others. The image of the gray-haired gentleman must have inspired confidence in our users, as we had far more people subscribe when he appeared on the screen. Think about that: we made more money just by using bucket testing instead of gut feel.
Once you’ve tasted success with A/B testing, you won’t be able to go back. You’ll realize how much more effective your decision making can be when powered by data, and you’ll want to incorporate data into every aspect of your product development process.
Incorporating data into the product development process
Here is how Etsy used to develop products:
Build feature.
Rent warehouse for launch party.
Release feature.
Launch party.
Wait 20 months.
Delete feature for lack of usage.
[McKinley 2014a], Dan McKinely, Software Engineer at Etsy and Stripe
In my experience, this description applies not only to Etsy but to the vast majority of companies. Figure 4-3 shows a rough diagram of this product development process.
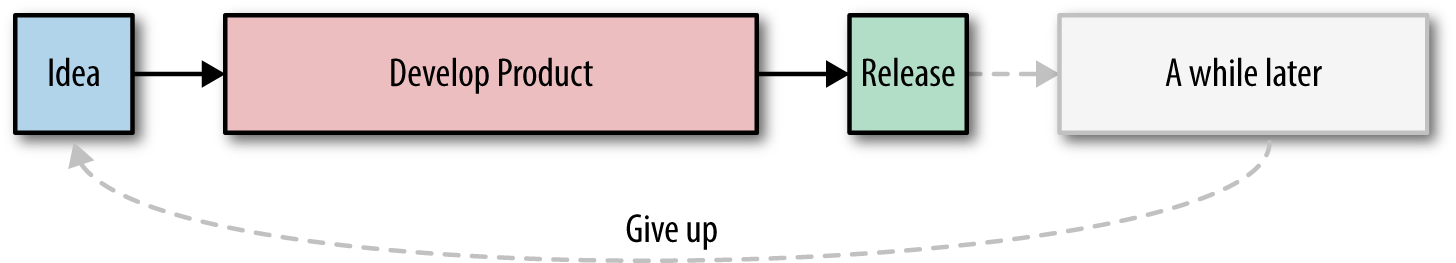
Figure 4-3. Typical product release process (diagram based on a talk by Dan McKinely [McKinley 2014a])
The odds of building a successful product this way are low. Even worse, sometimes you can’t even tell if you were successful or not. Let’s say you redesign your website, and a week later your activation numbers are up by 10%. It’s possible the redesign caused the uptick but it’s also possible that the real cause was something entirely unrelated, such as a change to your website’s ranking on Google search. With this product release process, there’s no way to be sure.
One way to solve this problem is to run an A/B test. Instead of releasing the new feature to all users, you randomly partition users into either group A, which is a control group that doesn’t see the new feature, or group B, which is the experimental group that does get to see it.3 After some amount of time, depending on how long it takes you to get enough website visitors for the results to be statistically meaningful,4 you look at the metrics for group B and see if they are any different from those of group A. If they are, the new feature is the most likely cause, as that should be the only variable that changed between the two groups.
If the new feature gets your metrics to improve, you can roll it out to all users. If not, then you throw it away and go back to the drawing board. This gives you the slightly better product development process shown in Figure 4-4.
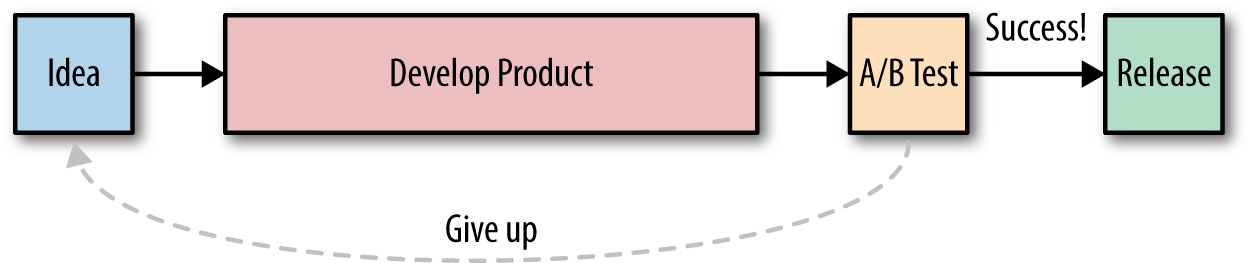
Figure 4-4. Typical product release process with A/B testing at the end (diagram based on a talk by Dan McKinely [McKinley 2014a])
The remarkable thing is that when you use this process and A/B test just before a release, you are likely to find that most of your features either hurt your metrics or have no impact. This is exactly what Etsy found when they started A/B testing. It’s a pattern I saw at LinkedIn and at almost every single startup I talked to for this book. All of these companies are spending months or years and millions of dollars on developing new products, and in many cases, no one uses them and they throw them away after a year or two.
There are many reasons why a product might fail, but one of them is what Tim Harford calls the God complex. Many people, especially experts, hold the belief that they can solve almost any problem just by thinking very hard about it. They come up with elaborate product ideas, or clever engineering designs, or fancy diagrams and equations on a piece of paper, and await success. Except in the vast majority of cases, the success never comes. That’s because the world we live in is immensely complicated. We are constantly dealing with systems that are beyond any individual’s understanding, such as the free market economy, or the human mind, or a distributed computer system. The problems that affect these systems are too complicated to solve through reason alone.
I’m not trying to say we can’t solve complicated problems in a complicated world. We clearly can. But the way we solve them is with humility—to abandon the God complex and to actually use a problem-solving technique that works. And we have a problem-solving technique that works. Now you show me a successful complex system, and I will show you a system that has evolved through trial and error.
[Harford 2011], Tim Harford, Economist
Instead of intelligent design, we need evolution. That means letting go of the God complex and admitting to yourself that you don’t know the right answer. This is hard because schools condition you to think that there is a right answer to every problem and that you can get it just by thinking hard. And while that’s true of the simple, constrained, cookie-cutter problems you do in school, the type of problems you deal with in the business world have no easy, obvious solutions. Company after company has found that the only way to survive in such a world is to try as many things as possible and see what works.
In examining the history of the visionary companies, we were struck by how often they made some of their best moves not by detailed strategic planning, but rather by experimentation, trial and error, opportunism, and—quite literally—accident. What looks in hindsight like a brilliant strategy was often the residual result of opportunistic experimentation and “purposeful accidents.”
[Collins Porras 2004, 141], Jim Collins and Jerry I. Porras, Built to Last
Note that trial and error is not the same thing as blind guessing. You still try to reason through problems as best you can, but you acknowledge that some of your assumptions are wrong and that the only way to find out which ones is through trial and error. And as scientists have known for centuries, the proper way to do trial and error is through controlled experiments.
Data-driven development through controlled experiments
Building out an entire feature or product only to see that it has no impact after you run an A/B test is expensive and painful. Is there a way to avoid all this wasted effort? Well, just as you can’t eliminate all uncertainty with measurement, you can’t eliminate all wasted effort when building products, but you can reduce it. To do that, you need to use data and controlled experiments throughout your entire development process. As shown in Figure 4-5, instead of investing in building out the whole product right up front, you use an iterative methodology:
-
Build an MVP.
-
A/B test it.
-
Analyze the results and make one of three decisions:
-
Refine: the numbers look good enough to justify developing the MVP further. Go back to step 1.
-
Release: the numbers look great and the product is done. Release it to everyone.
-
Give up: the numbers are not good enough to justify continued work. Move on to the next idea.
-
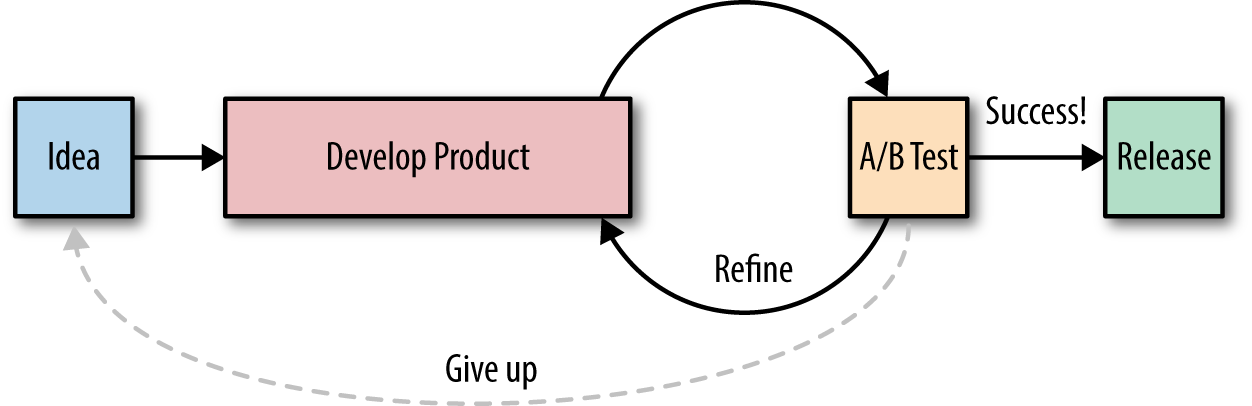
Figure 4-5. Data-driven development (diagram based on a talk by Dan McKinely [McKinley 2014a])
Instead of making a large investment in the product up front, you iteratively make small investments in MVPs that test your assumptions, gather data from each experiment, and only invest further if the numbers merit it. For example, on the first iteration, the MVP may just be a paper prototype and you use the customer validation process to chat with real customers to see if you’ve identified whether the prototype resonates with them (see “Customer development”). If the customer feedback looks good, the next iteration could be a Wizard of Oz MVP (see “Types of MVPs”) and an A/B test. If the A/B test shows that the MVP is having a positive impact on your metrics (especially your magic number), you could build out the prototype more fully and run another A/B test. You continue this build-validate cycle until the product is done or it’s clear that the idea is not working, in which case you give up. But even if the idea doesn’t work out, with a data-driven process, you find that out earlier and significantly reduce wasted effort. Speed wins.
Data-driven development strengths and weaknesses
“Design like you’re right. Read the data like you’re wrong.”
[Lilly 2015], John Lilly, Partner at Greylock
Data-driven development will reveal if something you built is working, but it’s up to you to interpret the data and understand why that’s the case. Data-driven development is superb at comparing options, but it’s up to you to come up with the options in the first place. And data-driven development is the perfect way to incrementally improve a product, but it’s up to you to make massive jumps to avoid getting stuck in local maxima. In short, data-driven development works best when you combine the strengths of a human being (i.e., creativity and insight) with the strengths of a computer (i.e., data collection and measurement). Use data as a way to inform your decision-making process and not as a way to replace it.
Besides informing your product development process, you can also use data as an ingredient for building data products. For example, one of the most recognizable features on LinkedIn is People You May Know (PYMK), a recommendation system that tries to predict who else you might know on the site. PYMK generates recommendations by processing a vast amount of data, including connection data (e.g., if Alice knows Bob and Bob knows Carole, perhaps Alice knows Carole, too), education and work data (e.g., if Alice and Bob were at the same school or company at the same time, they are more likely to know each other), and geographical data (e.g., if Alice and Bob are in the same city, they are more likely to know each other). It also feeds user behavior data (i.e., whether a user clicked on one of the recommendations or not) into the recommendation engine as feedback (i.e., reinforcement learning).
Data products can be a powerful differentiator. For example, PYMK is responsible for more than half the connections on LinkedIn. Amazon has reported that 35% of product sales come from its recommendation system [Marshall 2006]. And Netflix is known for its movie recommendation system, in part because it makes great recommendations and in part because they held a competition where they offered $1 million to anyone who could build a better system.5
Distribution
So far, we’ve talked about all the ways to build a great product: you need a great idea, you need to build a cheap MVP, you need to come up with a simple design, and you need to use data to inform your decisions. Unfortunately, even if you manage to put together an amazing product, the best product does not always win.
In the late 90s, TiVo came out with the first consumer DVR and developed a very loyal following of customers who raved about the ability to pause and rewind live TV and schedule recordings of all of their favorite shows. But by 2008, TiVo’s market share in the DVR space was a mere 6%. The other 94% was dominated by cable companies who sold DVRs that, by all accounts, were inferior to TiVo (fewer features, worse user experience). However, the cable companies had a superior distribution strategy: they offered the DVR as an upgrade to the cable box that their customers were required to get anyway [Machefsky 2008].
In the early 80s, Microsoft’s DOS operating system was not as powerful or user friendly as Apple’s operating system, but while Apple kept its software proprietary and only allowed it to be distributed on Apple hardware, Microsoft licensed its operating system to anyone who would buy it. And buy it they did. Dozens of desktop manufacturers, including IBM and all the IBM PC clones, licensed Microsoft’s operating system and flooded the market with cheap PCs. By 2000, Microsoft had replaced DOS with Windows, and while it was still arguable whether it was as good as Apple’s OS, it controlled 97% of the market [Yarow 2012].
If we lived in a world with perfect information, the best product would always win. But we don’t live in such a world. These days, there are way too many things vying for our attention and there’s simply no way for any customer to be aware of even a fraction of the products out there. And if the customer doesn’t know you exist, it doesn’t matter how good your product is. Therefore, it’s not the best product that wins, but the product the customer thinks is best. Making customers aware of your products and influencing how they perceive them is known as distribution.
The saying “If you build it, they will come” is not true. There is no such thing as a product that sells itself. If you want to succeed, you have to build not only a product, but also a way to distribute it.
It’s better to think of distribution as something essential to the design of your product. If you’ve invented something new but you haven’t invented an effective way to sell it, you have a bad business—no matter how good the product.
[Thiel 2014, 130], Peter Thiel, Zero to One
Let’s take a look at the four most common distribution channels for startups:
-
Word of mouth
-
Marketing
-
Sales
-
Branding
Word of mouth
The most powerful way to spread the message about your product is for you not to spread it at all. Instead, let your customers do it. No company can afford to pay for every marketing contact, so just about every company relies on some form of word-of-mouth distribution [Moore and McKenna 2006, 36-37]. That is, someone who is a customer recommending your product to someone who is not a customer. There are three things you can do to increase distribution through word of mouth:
-
Build a better product
-
Provide great customer service
-
Build viral loops into your product
Build a better product
Although no product can truly sell itself, you can come close to this ideal by building a product so good that customers can’t stop talking about it. For example, CrossFit is a fitness company and training program that was founded in 2000. Now, 15 years later, it is one of the fastest-growing sports of all time, with more than 10 million CrossFitters working out at over 10,000 affiliates across the world [Oh 2014] (for comparison, it took McDonald’s 33 years to get to 10,000 affiliates [History of McDonald’s 2015]). One of the reasons that CrossFit has grown so quickly is that it’s like no other fitness program out there. Instead of promising you abs in five minutes by doing the same workout every day on fancy exercise machines in an air-conditioned gym, CrossFit promises you a lot of hard work in the form of intense and constantly varied full-body workouts that mix all aspects of fitness (running, lifting, gymnastics) and are done in unadorned buildings, garages, and parking lots using barbells, kettlebells, gymnastics rings, ropes, sleds, tractor tires, and sledge hammers. It is so wildly different than other fitness programs that CrossFitters cannot shut up about it. Or as the joke goes, “How can you tell that someone does CrossFit? Don’t worry, they’ll tell you.”
Notice that what makes CrossFit worthy of discussing is how different it is. It’s not about having every possible feature (as a fitness program, CrossFit has plenty of gaps and weaknesses), but about being exceptional at a small number of features (see “Focus on the differentiators”). Focusing on your differentiators is not only important for building a great MVP but also for increasing the odds that customers will notice your product because it stands out from the rest.
In his TED Talk “How to Get Your Ideas to Spread,” Seth Godin has a great analogy for this idea [Godin 2003]. Imagine you were driving along and saw a cow on the side of the road. Would you stop and take notice? Probably not. You’ve seen cows plenty of times in your life, so you’d just keep on driving. But if you saw a purple cow, you’d almost certainly pull over and take some pictures. Why? Because a purple cow is remarkable. It works the same way for products. Consumers are so overloaded with product choices and marketing messages that the only way you’re going to get them to pay attention to you—and just as importantly, get their friends to pay attention to you—is if you do something remarkable. You have to stand out and give people something worth talking about.
Provide great customer service
No matter how hard you try to build an amazing product, you won’t get everything right. Customers will have questions. They will run into bugs. They will find corner cases and make requests for new functionality. This is where customer service comes in. It might seem strange to lump customer service into a discussion about distribution, but many companies have found that if you do customer service exceptionally well, you can turn it into your differentiator and get powerful word-of-mouth effects:
Over the years, the number one driver of our growth at Zappos has been repeat customers and word of mouth. Our philosophy has been to take most of the money we would have spent on paid advertising and invest it into customer service and the customer experience instead, letting our customers do the marketing for us through word of mouth.
I personally think it’s kind of funny when I attend marketing or branding conferences and hear companies talk about consumers being bombarded with thousands and thousands of advertising messages every day, because there’s usually a lot of discussion among companies and ad agencies talking about how to get their message to stand out. There’s a lot of buzz these days about “social media” and “integration marketing.” As unsexy and low-tech as it may sound, our belief is that the telephone is one of the best branding devices out there. You have the customer’s undivided attention for five to ten minutes, and if you get the interaction right, what we’ve found is that the customer remembers the experience for a very long time and tells his or her friends about it.
[Hsieh 2013, 143], Tony Hsieh, Delivering Happiness
If you really want to be exceptional at customer service, it’s usually not enough to have a separate, outsourced customer service department. Zappos makes every employee participate in customer service (see “Culture fit”). Similarly, every engineer at Stripe, and even the founders, do customer support on a biweekly rotation [Maccaw 2012]. How can you possibly scale a company if the engineers are doing customer service? Well, as we’ve discussed before, in the early days of a company, it’s perfectly fine to do things that don’t scale. But involving everyone in customer service can scale surprisingly far, as it not only gets you loyal customers who spread the product by word of mouth but also helps you build a better product by making the people who write the code feel the pain of the customers that use it. For example, Paul English, the co-founder of KAYAK, installed a customer support phone line in the middle of the engineering floor. People would often ask him “Why would you have high-paid engineers answering customer phone calls?” and his response was, “Well, after the second or third time that the phone rings, and the engineer gets the same problem, they stop what they’re doing, they fix the bug, and they stop getting phone calls about it” [Hale 2014].
We talked in Chapter 3 about using customer development to constantly validate assumptions with real customers by getting out of the building. Customer service has the same benefits, except in this case, the customers come to you. Make it easy for them by making sure there is a feedback email address or phone number in an obvious place in your product and/or by using tools such as ZenDesk, Groove, and Get Satisfaction to manage communication with your users.
Build viral loops into your product
Many people are talking about using a “viral marketing strategy” these days, but the truth is that there is no such thing. A blog post or video that “goes viral” on all the social networks isn’t a marketing strategy but dumb luck. You can’t predict it, you can’t control the audience that sees it, and you can’t turn it into a sustainable strategy for distribution. Virality is no more than another way of saying word of mouth. If you want to encourage word of mouth beyond the mechanisms we already discussed (building a better product and providing great customer service), then what you need is not a viral marketing strategy, but to build a viral loop into your product.
A viral loop is a feature in the product that gives current users an incentive to recruit new users. The new users, in turn, have an incentive to invite even more users, spreading your product like a virus. For example, in the late 90’s, PayPal offered current users $10 for every friend they referred and new users got $10 for signing up. The bet was that once users signed up, they’d be hooked on the service and would be sending enough money back and forth to cover the $20 acquisition cost per user. It was a huge risk and probably not one many other companies should try to copy, but it paid off for PayPal, propelling growth to as much as 7%–10% per day until the service had over 100 million users [Masters 2012, sect. III].
Some viral loops require no user intervention at all. For example, when Hotmail first launched in 1996, they were one of the world’s first free web-based email services, but they were struggling to find a way to communicate that message to a large number of users. They decided to try a viral tactic: each time a user sent an email, Hotmail automatically added a signature to the bottom of the email that included a link with the text “Get your free email at Hotmail.” When someone received an email from a Hotmail user, they would see that (a) the sender, who was often someone they trusted, was a user, (b) the service worked, and (c) the service was free. As soon as the signature went live, Hotmail’s growth took off. They started adding thousands of users per day, a million within six months, 2 million a few weeks after that, and so on [Penenberg 2009, chap. 4].
The most powerful viral loops are those that are an intrinsic part of using the product. If you have a product where a customer doesn’t get value out of it unless someone else uses it, such as telephone, video chat, or messaging, then inviting new customers becomes an inherent part of using the product, and you have a chance for rapid viral growth. However, there is a catch. How do you get the initial customers to sign up? How do you convince someone to buy a telephone when no one else has a telephone and there is no one to call? This is known as the cold start problem. Products like the telephone are subject to Metcalfe’s Law: the value of the product is proportional to the square of the number of users (n2). That means it’s hard to get such a product started (02 is 0), but once you get the ball rolling, you get strong network effects, where every new user significantly increases the value of the network, which attracts more new users, which increases the network value even more, and so on.
Social networks are a classic example of the power of intrinsic viral growth and network effects. The whole point of social networking is to connect with other people, so sending invites is an inherent part of using the product, leading to explosive growth. At the end of 2014, LinkedIn had 347 million members [LinkedIn 2014] and Facebook had nearly 1.4 billion [Facebook 2014]. How did these networks solve the cold start problem? First, they made it easy to invite non-members to the service by allowing you to import contacts from your email, phone, and other existing networks (it’s easier to build a viral software product because new users don’t need to purchase anything physical, such as a phone). Second, they offered users something valuable even before the network was large. For example, even when LinkedIn had very few members, it was still useful as a public place to store your résumé so that potential employers and business partners could find you.
These examples should dispel a few myths about viral loops. First, they are not free. It always costs something to build a viral loop into the product, and if the viral mechanism isn’t an inherent part of the user experience, you might have to pay for each new user, as in the case of PayPal. Second, while almost every product can benefit from word of mouth, not every type of product will be able to include a viral loop. Here are some questions you should ask:
How can a user create content that reaches another user?
How does a user’s experience get better the more people they are connected to on it?
[Nash 2012], Adam Nash, President and CEO at Wealthfront
If your product is inherently social—that is, it is meant to be used by multiple people collaboratively, such as a social network, a file sharing service, or a payments app—the answers to these questions are typically easy. If not, then building a sustainable viral loop is likely to be difficult. To see if it’s worth your time, you can do some back-of-the-envelope calculations to see what kind of payoff you might get.
The first step is to estimate your viral coefficient. The viral coefficient (AKA viral factor) is a number that answers the following question:
Given that I get a new customer today, how many new customers will they bring in over the next N days?
[Nash 2012], Adam Nash, President and CEO at Wealthfront
The number N represents a reasonable cycle time for your business. That is, how long does it typically take for a new customer to send out invites and for the recipients to respond to them? For example, for a product like Facebook, a reasonable guess might be N = 1 day because a new user will typically send out all their invites right after registering, and because the invites go out by email and mobile notifications, the recipients are likely to see and respond to them that same day. On the other hand, for a product like SlideShare, a new user may post a slide deck and share it with their friends right after registering, but the friends probably won’t sign up for SlideShare until they have their own slide deck to share, which might not be until many months later, so perhaps N = 180 days.
To calculate your viral coefficient (K), you need to take the number of invites (I) your users send every N days (i.e., how many times a current user performs an action that could potentially recruit a new user, such as sending an invite on a social network) and multiply it by the average conversion rate (C) on those invites (i.e., what percentage of the invites are accepted).
For example, let’s say you launched your product today and 1,000
people signed up. You look at the metrics and find that those 1,000 users sent
5,000 invites shortly after registering, or an average of I = 5
invites per user. Those invites get a lot of clicks the first few days, tailing
off to zero after about a week, so your cycle time is N = 7 days. At the end
of that week, you’ve found that the invites got 500 new users to sign up, so
your conversion rate is C = 500 / 5,000 = 0.1. That gives you a
viral coefficient of ![]() .
Assuming these numbers hold, you will have
.
Assuming these numbers hold, you will have
![]() new users after the first week,
new users after the first week,
![]() new users after the second week,
and so on:
new users after the second week,
and so on:

For a viral coefficient of K and a cycle time of N, you can calculate the number of users T days after launch as:
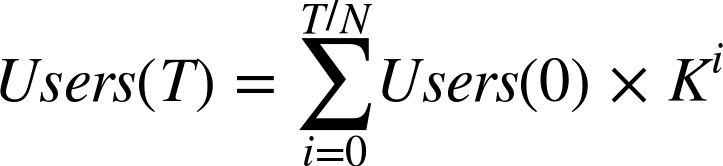
If you remember your high-school math, this is a geometric series, and the sum of the first x terms of this geometric series can be expressed as:
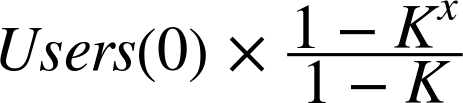
If K < 1.0, as x approaches infinity, Kx will go to 0, reducing the equation to:
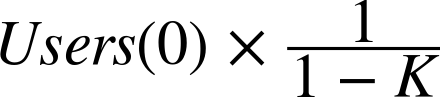
If you plug in your viral coefficient of K = 0.5, you’ll see that this geometric series converges to double the number of users you started with. Similarly, if you plug in K = 0.67, you will see that it triples your users; K = 0.75 will quadruple your users, and so on. This means that a viral coefficient between 0 and 1 can be thought of as a fixed multiplier, as shown in Figure 4-6. When you combine it with other sustainable distribution strategies, viral growth is a powerful way to amplify your reach.
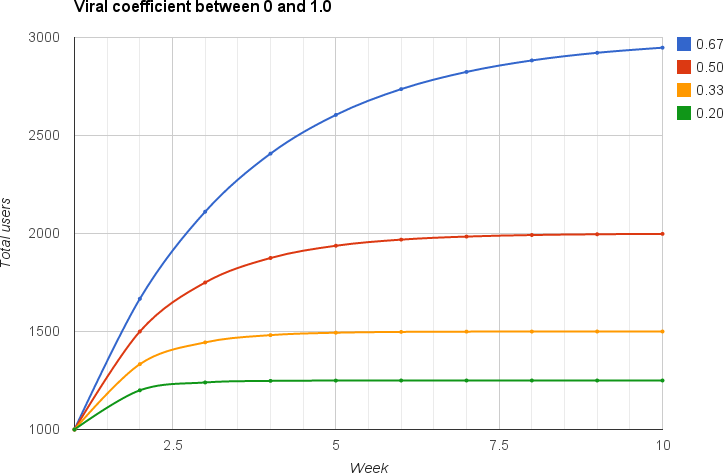
Figure 4-6. User growth if you start with 1,000 users and a viral coefficient between 0 and 1.0
But what if you had a viral coefficient of 1.0 or greater? For example, if you had a viral coefficient of 1.5, then the initial 1,000 users would bring in (1,000 * 1.5) = 1,500 users the next week. Those users, in turn, would bring in (1,500 * 1.5) = 2,250 users the week after, and then 3,375 the week after that, and so on. If you continue this pattern, you get exponential growth and before long, every human on earth is using your product. This is obviously unrealistic. In the real world, no product can maintain a viral coefficient above 1.0 for more than a short period of time, and most products have a coefficient that is much smaller:
True viral growth is incredibly rare. It took me a while to appreciate this: very few products have sustained a viral factor over 1 for any meaningful period of time. But if we shouldn’t bet on a viral factor greater than 1, what should we use in our model? From discussions with other entrepreneurs, investors, and growth hackers, I’ve learnt the following: for a consumer internet product, a sustainable viral factor of 0.15 to 0.25 is good, 0.4 is great, and around 0.7 is outstanding.
[Vohra 2012], Rahul Vohra, Co-founder of Rapportive
Because very few products can sustain a viral factor over 1.0, you can’t rely solely on a PR push and viral growth. You need some other sustainable distribution mechanism. For example, let’s say your product gets 10,000 visitors per week via Google search (see “SEO”), and that you’re able to get 500 of these visitors to register. Take a look at Figure 4-7 to see what happens when you combine your initial 1,000 users from the PR push, plus the 500 users who register from search, plus a variety of different viral coefficients.
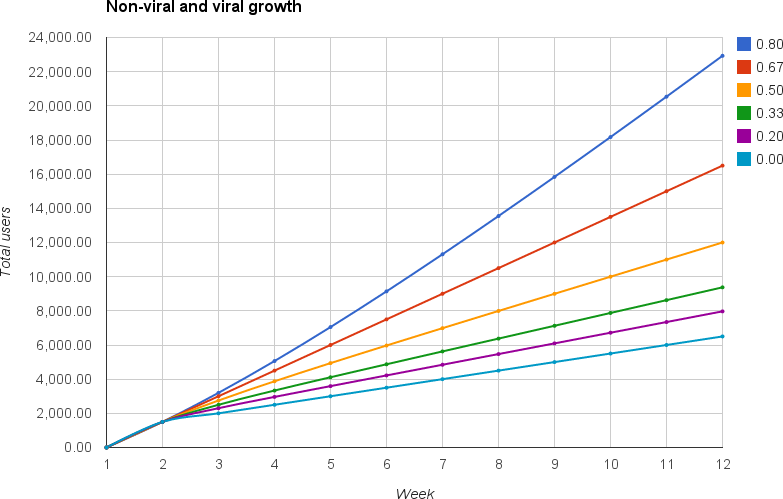
Figure 4-7. Combining viral and non-viral growth
If your product isn’t viral at all, after 12 weeks, you have a little over 6,500 users. If you have a viral coefficient of 0.5, you’ll have roughly 12,000 users, and if you’re really crushing it and have a viral coefficient of 0.8, you’ll have almost 23,000 users. Note that this calculation doesn’t take into account many factors, such as user retention (e.g., every week, some percentage of users stop using your product) and the way the viral coefficient changes over time (e.g., the calculation assumes that new users send invites when they join, but never after that). For a more complete discussion of how to model viral growth, as well as some handy spreadsheets you can use to do all the calculations for you, check out Rahul Vohra’s series of posts on “How to Model Viral Growth” [Vohra 2012].
Marketing
Let’s now turn our attention from word of mouth, where new customers find out about your product from existing customers, to marketing, where new customers find out about your product directly from you. There are many different ways to market a product, so we’ll just take a brief look at some of the most common ones used by startups:
-
Advertising
-
PR and media
-
Email
-
SEO
-
Social media
-
Inbound marketing
Advertising
Advertising is almost synonymous with marketing. You figure out where your potential customers are already directing their attention and you pay money to put a message about your product there. The good thing about advertising is that it works. The bad thing about advertising is that everyone knows it works. Advertising is a $220 billion industry in the United States alone [Advertising Spending in the United States 2014], and anywhere you turn, there are ads vying for your attention. There are commercials on TV, the radio, airplanes, billboards, and the sides of buses; there are product placements and celebrity endorsements in every movie and show; there are ads in every newspaper, magazine, stadium, movie theater, and concert hall; there are ads on park benches and sidewalks, on T-shirts and hats, on stickers and decals; and, of course, there are ads on your computer and smartphone in the form of banner ads, floating ads, search ads, sponsored updates in newsfeeds, mobile ads, and all manner of interstitial ads that you have to wade through to watch a video or read an article.
If you’re going to spend money on advertising, you have to set up detailed tracking of your acquisition channels so you can tell if the advertising is working or not (see “Acquisition”). This is easier to do with online advertising, where you can usually tell if the user came through an ad click, and if they did, see how much that ad cost you and how much money that user made you in return. Although more difficult, it’s also possible to track traditional ads such as TV commercials. One option is to use promo codes. For example, in each ad campaign, you can tell users to enter a specific promo code to get a discount, which gives users an incentive to come and check you out, and gives you the ability to track where they came from. Another option is to use consumer surveys. For example, when TripAdvisor launched a series of TV ads, it sent out surveys to its users to see how many people the campaign had reached and the effect it had on them [Schaal 2015].
Although surveys and promo codes are not as accurate as online tracking, your goal is not perfect data but just a reduction in uncertainty. Make sure to measure both where users came from and who they are, as you need to be sure not only that your advertising is reaching an audience but that it’s reaching the right audience, which is often tricky to do with broadcast mediums like television and billboards.
PR and media
Besides advertising, public relations (PR) is another great way to get a message about your product in front of a large audience. To do that, you have to build relationships with people in the TV and movie industries, journalists, bloggers, and celebrities. Of course, if you do something that’s remarkable (or something that’s remarkably bad), sometimes they’ll talk about you even if you don’t ask.
For most startups, PR events are unpredictable, occasionally negative, and rarely a sustainable distribution strategy. They are a great way to get a spike in traffic, but after a few days, the spike usually dies down and you need to start all over again.
When done right, email marketing is incredibly effective. When done wrong, it’s just spam. The wrong way to use email is direct marketing, where you buy an email list and send a mass email to a bunch of strangers who have never heard of you. This is not a sustainable strategy, as the click-through rate (CTR) on such emails is miniscule (typically just a fraction of a percent) and your emails quickly get classified as spam by most major email carriers. This could end up hurting your company’s reputation so you’ll only be able to send a few campaigns of this sort.
A better way to use email is to build an email list of users who opt in to receive information about your product. For example, you could give users a way to sign up for a newsletter on your landing page (see “The MVP”). Customers often take a long time to make a purchase decision and they may have to see the product over and over again before they warm up to it. Sending an occasional reminder email with useful information can be a great way to turn a warm lead into a paying customer. Compared to direct marketing, this approach will get you a slightly higher CTR (maybe 1%) and your emails are less likely to be categorized as spam.
The best way to use email is to send personalized emails in response to user actions or events the user cares about. For example, every time someone tags you in a photo on Facebook, you get an email. I don’t know about you, but my CTR on such emails is pretty much 100%, as I have to make sure it’s not an image I’ll regret. In 2011, LinkedIn launched the “Year in Review” email, an annual email that shows you photos of all of your colleagues who made significant career changes over the last year. The CTR on this email was astronomical, as many users clicked on more than one link in the email (CTR > 100%?) to find out who got a new job or a promotion.
The important thing to realize about email is that it’s not a good tool for getting new users (acquisition), but it’s one of the best tools for engaging existing users (activation, retention, referral, and revenue). There are many different kinds of emails you can send, such as welcome emails, onboarding emails, re-engagement emails, and referral campaigns. Check out the sendwithus “How to Send Email Like a Startup” guide for more info.
SEO
Search Engine Optimization (SEO) is optimizing your website so that it ranks highly in search results. Google saw 1.2 trillion searches in 2012 [Google Zeitgeist 2012] and many large businesses have been built by carving out a slice of this massive query volume. If your product has a large amount of unique and valuable content, such as user reviews (e.g., TripAdvisor), discussion forums (e.g., Reddit), Q&A (e.g., Stack Overflow), or reference material (e.g., Wikipedia), you may be able to drive thousands or millions of page views more or less for free through SEO. And not only does this get you a large amount of fairly sustainable traffic, but it’s often traffic that converts well because it represents people who were searching for the exact kind of content you have.
The catch is that the ranking algorithm used by Google and all other search engines is kept secret. Google has published an SEO starter guide and there are many other resources with SEO tips and tricks,6 but there is no guarantee that these correspond to the way the ranking algorithm actually works. Making things even harder is that Google changes its ranking algorithm more than 500 times per year, and although most of the changes are minor, some can have a dramatic effect on your ranking.7 This means that SEO isn’t entirely free: you have to put in work up front to optimize your site and you have to stay up to date with the ranking-algorithm changes to keep your site at the top of the results pages. And, of course, you have to compete with all the other websites that are trying to do the same.
The good thing about SEO is that the ranking algorithms generally reward behavior you should be doing anyway. For example, the most important “optimization” you can do is to have a lot of high-quality content on your website—that is, you need to build a better product (see “Build a better product”). If you do, a lot of other websites will link to you, and when users click to your website, they won’t bounce immediately—both factors that increase your page rank. All the other optimizations, such as tweaking header titles, URLs, domain names, and meta tags, are also useful but won’t have nearly as big of an impact as building a better product.
Social media
Many companies are turning to social media for distribution, and for good reason, as social networks have massive and highly engaged audiences. Building a following on Facebook, Twitter, LinkedIn, Instagram, Pinterest, and similar sites is a great strategy for engaging users you already have—it’s like a more modern version of the email newsletter. Even better, social media allows you to engage with users on an individual level, which makes it an effective customer service tool. The only thing it’s not particularly good at is user acquisition. When you share something on Twitter or Facebook, your existing followers will see it, but no new users will unless someone reshares it. Occasionally, some of your content might get a huge number of reshares and “go viral,” which can put your product in front of a lot of new users. However, this is much like a PR push, where it’s a one-time boost that’s too unpredictable to rely on as a sustainable form of user acquisition.
Inbound marketing
Inbound marketing is about trying to attract customers’ attention using content they find valuable rather than trying to buy customers’ attention, as with advertising. Think of it as trying to bring customers in using a honeypot (inbound marketing), rather than sending your marketing messages out using a loudspeaker (outbound marketing). Your honeypot can be in the form of a blog, a podcast, a video, a book, or a set of open source tools, and you usually combine it with SEO and social media sharing to help customers find it. The key idea behind inbound marketing is not to try to sell something to the customer, but to try to teach them.
Teach and you’ll form a bond you just don’t get from traditional marketing tactics. Buying people’s attention with a magazine or online banner ad is one thing. Earning their loyalty by teaching them forms a whole different connection. They’ll trust you more. They’ll respect you more. Even if they don’t use your product, they can still be your fans.
[Fried and Hansson 2010, 173], Jason Fried and David Heinemeier Hansson, Rework
Inbound marketing is an especially useful strategy for startups, as they can’t compete with the ad budgets of larger companies but can produce valuable content. sendwithus is a great example. They run a blog that has tips on email marketing; they publish a free, comprehensive guide called “How to Send Email Like a Startup,” and they give away lots of email tools (e.g., templates, components, layouts) for free.8 If you’re searching for help with sending email, you’re more likely to click on free, valuable content than an ad or any overt message trying to sell you a product. As you read the sendwithus blog and use their tools, an association will slowly form in your mind between sendwithus and email. You’ll start to think of them as the experts on email. They will be your go-to when you have questions. And then, one day, when you do need a paid email product, you are more likely to become their customer.
Sales
Marketing is about getting the customer to the door (acquisition). Sales is about closing the deal and getting the customer to make a purchase (revenue). If you have a “self-serve” product, such as a website where customers can plug in their credit card information to make a purchase, then your sales and marketing process are largely one and the same. However, there are many kinds of products where sales requires human intervention—a salesperson to take the customer through the process, answer questions, and hash out the details in a contract. Roughly 14 million people in the United States are employed in sales [Sales and Related Occupations 2013], which is nearly 5% of the population. The reason it’s such a popular profession is that sales is fundamental to the success of most businesses, and even more generally, to the success of most things in life.
The most fundamental reason that even businesspeople underestimate the importance of sales is the systematic effort to hide it at every level of every field in a world secretly driven by it.
[Thiel 2014, 129], Peter Thiel, Zero to One
Just about every profession involves sales. The CEO of a company is, in may ways, a salesperson, selling the company’s vision to customers, investors, shareholders, and employees. If you’re in marketing or politics, you also spend most of your time selling. And even if you’re a programmer, every time you interview for a job, negotiate an offer, or try to convince your team to adopt a new technology, you’re also a salesperson. Of course, none of these jobs have “sales” in the title, because it’s one of those games we all play where you can’t acknowledge the game itself, or it falls apart. If you admit that you’re flirting with someone, you probably won’t get a date, and if you admit that you’re trying to sell something, you probably won’t close the deal. No one wants to be sold to, but everyone wants to buy something, which is what makes sales such a difficult profession.
How do you learn sales? Convince somebody to go use your product. It’s like in The Wolf of Wall Street: try to sell me this pen. Seriously, try it out. How would you do it? How would you make this pen important to me? Once you learn that, you’ll know how to sell.
[Shoup 2015], Matthew Shoup, Principal Nerd at NerdWallet
If you’ve founded a startup, selling your product—even if (or especially if) you’re not a salesperson by trade—is a valuable exercise. Before you hire a sales team and before you spend a bunch of money on marketing, you should get out of the building, talk to customers in person, and try to sell your product (see “Customer development”). Only after you’ve made a few sales yourself, and thereby figured out what’s important to the customer and what sales strategy works, should you worry about hiring a separate sales team (see “Do things that don’t scale”).
Once you do reach that stage, the type of sales team you need depends largely on your product. Broadly speaking, there are three categories of sales:
-
Automated sales are self-serve systems where a customer can make a purchase without talking to a human representative, such as a checkout form on a website like Amazon.com.
-
Inside sales are salespeople who do most of their sales in their employer’s workplace. One common type of inside sales is a salesperson who works in a store or dealership and sells products over the counter, such as an employee of an Apple store. Another common type is a salesperson who works in an office and sells products over the phone, email, chat, and web conferencing. For example, many Software as a Service (SaaS) products, such as SalesForce, allow you to sign up for a trial or basic versions of the product online (automated sales) and if you want the more powerful version of the product, you can reach out to a sales representative by phone or email (inside sales).
-
Outside sales are salespeople who do most of their work at the customer’s workplace. They schedule in-person meetings with customers, give them on-site demos, and spend most of their time traveling to customer sites to talk directly with the relevant stakeholders.
Automated sales are the most scalable and cost-efficient option, but they generally only work for low-price products (less than $1,000). Outside sales is far more expensive and far less scalable—you have to hire a sales team and pay for their travel expenses, and each salesperson can only work with one customer at a time—but the personal attention allows you to sell much more expensive products that no one will order via an online checkout form ($100,000 and up). Inside sales falls somewhere in between. It costs more to run an inside sales team than an automated sales system, but not as much as an outside sales team, as an inside sales person in a store or making calls from an office can interact with many customers per day. This personal interaction with customers allows an inside sales team to secure larger deals than automated sales, but not as large as a dedicated outside sales team (deals in the $1,000 to $100,000 range are typical).
Branding
Earlier, I mentioned that it’s not the best product that wins but the product the customer thinks is the best that wins. How a customer thinks about your company—if they think about it at all—is your brand, and trying to influence that perception is called branding. Branding is not a single strategy or marketing campaign, but the sum of all the ways you interact with the customer: it’s what your company logo looks like, what you say in your tagline, how you present the company in your ads, what sort of expertise you give away in your inbound marketing, how your website looks, how your business cards look, what tactics your sales team uses, and how customer service treats the customer. Just as differentiators separate your products from other products, you brand needs to separate your company from other companies.
Red Bull makes sugary, caffeinated soda drinks, but its brand is something completely different. For example, the Red Bull website, as shown in Figure 4-8, shows a guy racing a dirt bike, college students at a party, and someone jumping off a mountain. The company runs a Red Bull TV channel that shows adventure sports like BASE jumping, free running, ice climbing, and whitewater kayaking; it owns a number of sports teams, including the New York Red Bulls (soccer), Infiniti Red Bull Racing (Formula One), and Team Red Bull (Nascar); and it sponsors events such as Red Bull Road Rage (an extreme downhill bike competition), Red Bull X-Fighters (freestyle motocross stunt competitions that take place in bullrings), and Red Bull Stratos (a space-diving project involving skydiver Felix Baumgartner, who did a free fall from 24 miles up and achieved speeds of over 800 mph) [Red Bull 2015]. When you think of Red Bull, you don’t think of a drink but of extreme activities. That’s its brand.
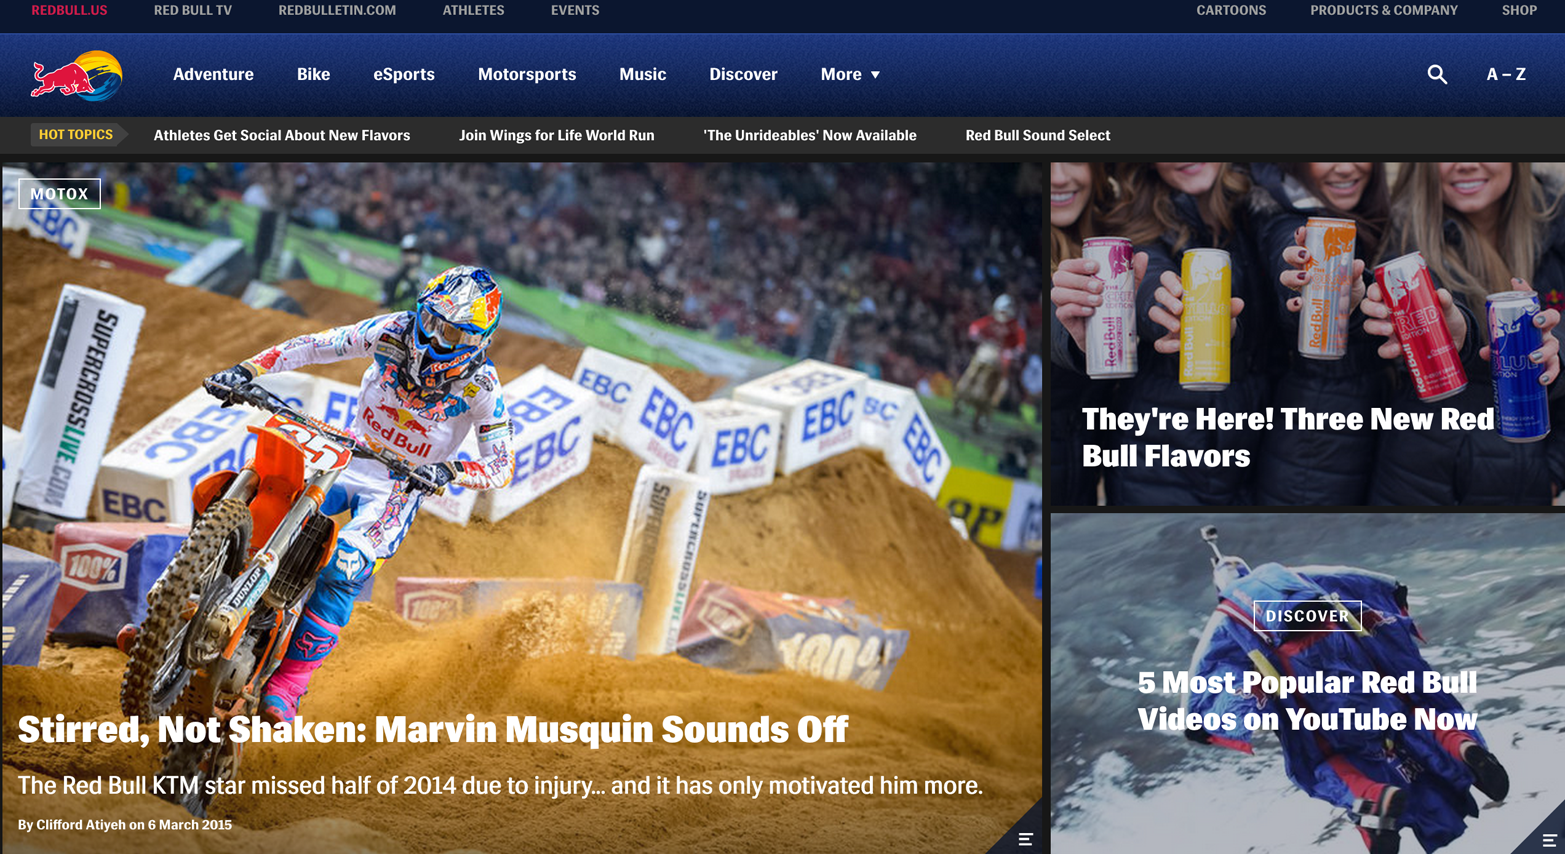
Figure 4-8. The Red Bull website
The thing to notice is that branding has very little to do with concrete products. It’s all about emotions and beliefs. It’s about why the company exists and not what it does (see “Core Ideology”). For example, Nike ad campaigns are not about shoes or air soles but about honoring great athletes and great athletics. Similarly, one of Apple’s most successful ad campaigns, “Think Different,” was not about computers, or CPU speeds, or why Apple was better than Microsoft but about answering the questions “Who is Apple and what do they stand for?” [Jobs 2007]:
Here’s to the crazy ones. The misfits. The rebels. The troublemakers. Round pegs in the square holes. The ones who see things differently. They’re not fond of rules and they have no respect for the status quo. You can quote them, disagree with them, glorify or vilify them. About the only thing you can’t do is ignore them. Because they change things. They push the human race forward. And while some may see them as the crazy ones, we see genius. Because the people who are crazy enough to think they can change the world are the ones who do.
[Jobs 2007], Apple
In just two words, “think different,” you know exactly what Apple is all about and why you should care. Crafting such a clear, compelling message is not easy, but just as copywriting is the most important aspect of product design (see “Copywriting”), it’s also the core of marketing. A great example of this is the tagline for a product. It has to be remarkable to catch people’s attention, show how you’re different, and be short and simple. For example, consider the slogan for the original iPod:
1,000 songs in your pocket.
[List of Apple Inc. Slogans 2015], Tagline for the original iPod
The iPod came out in an era when most people lugged around their music collection in massive CD wallets, where each CD held about 12 songs. The idea that you could have a music player that held 1,000 songs and still fit it into your pocket was remarkable.
In some sense, your brand is a promise that you’re going to change the customer’s life: “If you go with our company, here’s what you will be able to do.” Red Bull promises you the energy to do extreme activities. Apple promises you the technology that will allow you to think different. Note that the promise is not about what the product can do (features) but what the customer can do with your product (benefits). It’s a critical difference, as illustrated in Figure 4-9, but once you deeply grok it, you’ll find it easier to craft effective messaging.
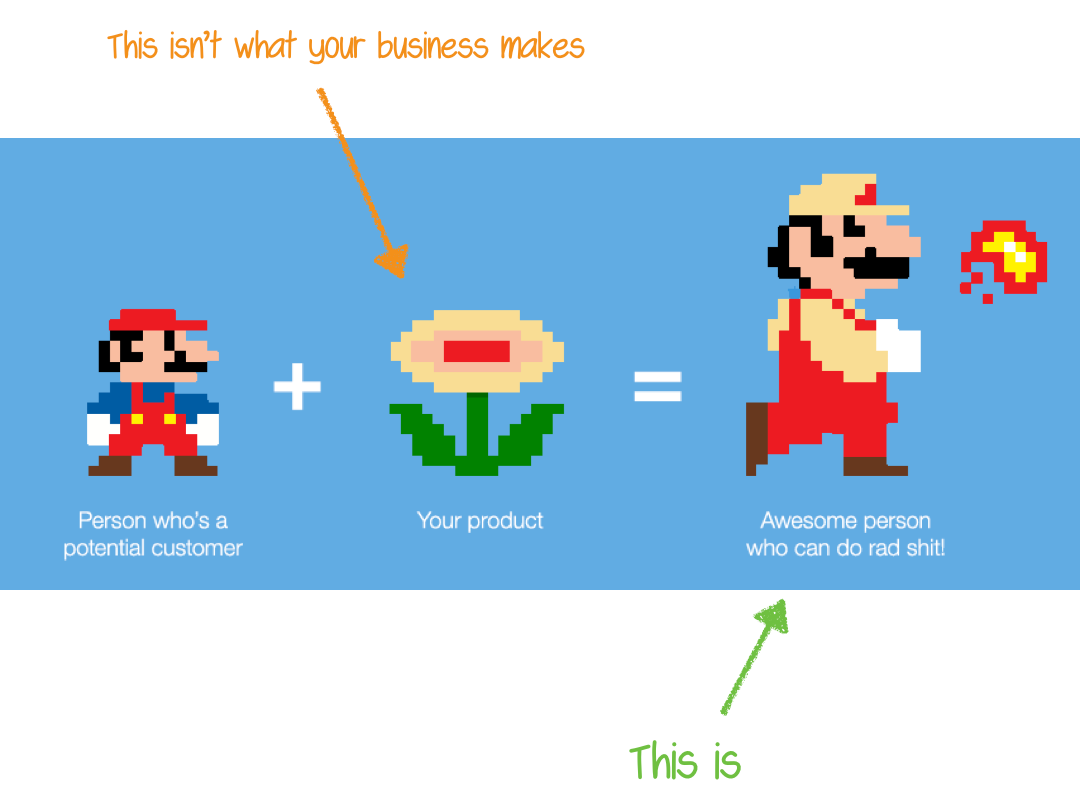
Figure 4-9. Features versus benefits (image courtesy of Samuel Hulick)
Recap
Y Combinator’s motto is “make something people want.” These four simple words manage to capture almost everything you need to know about building a successful startup. In Chapter 2, we talked about how to come up with ideas, and in Chapter 3, we covered how to design a basic product around them. These are, respectively, the “make” and “something” portion of “make something people want.” In this chapter, we looked at the other two words in that motto, “people” and “want,” in the form of “data” and “distribution,” respectively.
If we have data, let’s look at data. If all we have are opinions, let’s go with mine.
Jim Barksdale, former CEO of Netscape
Data is how you know you’re making something people want. Almost every decision you make can be improved by measuring and reducing your uncertainty. You can get a sense of how every aspect of your product is doing by carefully tracking your pirate metrics (AARRR): acquisition, activation, retention, referral, and revenue. And you can get your entire team aligned along the same mission by defining your “magic number” and using it to prioritize all projects. Most importantly, you can use data not only to track how past decisions have worked out but to inform future decisions. Put aside your God complex and use A/B testing to measure what people really want.
Think of a “perfect product” as a mousetrap. You’re going to catch the mouse, because it’s a mousetrap and it’s perfect for that, but even if it’s a perfect product, you still need to attract the mouse to it. So what you really need to make the mousetrap successful is to think about the bait and the placement. You have to use the right food to attract the mouse and you have to put the trap in the right location, against the wall, where you know the mouse is living. It’s all about placement and bait.
[Shoup 2015], Matthew Shoup, Principal Nerd at NerdWallet
Distribution is how you make something people want. To want something, your customer has to know it exists and find it desirable. This doesn’t happen on its own, so you have to use the right placement and bait, which in the startup world consists of word of mouth, marketing, sales, and branding. When you’re just starting out, your distribution strategy should mostly consist of the founders personally making sales. As the company grows, word of mouth, marketing, and branding will be necessary to scale. Which one you use depends on the type of product you’re building. Table 4-1 has a few examples from the real world.
| Number of customers | Type of product | Price range | Example company | Distribution strategy |
|---|---|---|---|---|
1,000,000,000 |
Physical goods |
$1–$10 |
Coca-Cola |
Marketing (advertising) |
1,000,000,000 |
Ads |
$1–$10 |
Word of mouth (network effects and virality) |
|
100,000,000 |
Physical goods |
$10–$100 |
Johnson & Johnson |
Marketing (advertising) |
100,000,000 |
Ads |
$10–$100 |
TripAdvisor |
Marketing (user-generated content and SEO) |
10,000,000 |
Video game |
$100–$1000 |
Blizzard |
Marketing (advertising) and word of mouth (virality) |
1,000,000 |
Software as a Service |
$1,000–$10,000 |
sendwithus |
Marketing (inbound marketing) |
100,000 |
Enterprise support |
$10,000–$100,000 |
MongoDB |
Sales (inside sales) |
10,000 |
Data analysis |
$100,000+ |
Cloudera |
Sales (outside sales) |
Putting it all together, if you get the right idea, design, data, and distribution, you’ll be able to make something people want.
An idea is not a design
A design is not a prototype
A prototype is not a program
A program is not a product
A product is not a business
A business is not profits
Profits are not an exit
And an exit is not happiness.
[Sellers 2011], Mike Sellers, Serial Entrepreneur
1 Just about all of these metrics can be tracked in mobile apps and on the web using Google Analytics (GA). It’s free and simple to use, so it’s a great choice when starting out.
2 See [Cook 2013] for an example.
3 Check out http://www.hello-startup.net/resources/mvp/ for a list of A/B testing tools.
4 Check out http://www.experimentcalculator.com/ to calculate the appropriate duration for an A/B test.
5 The details of the competition are posted online.
6 Moz has a pretty good SEO Best Practices guide.
7 Moz maintains a “change history” for Google’s ranking algorithm.
Get Hello, Startup now with the O’Reilly learning platform.
O’Reilly members experience books, live events, courses curated by job role, and more from O’Reilly and nearly 200 top publishers.

