Chapter 1. The Case for Performance
Images are awesome. Which website would you prefer to navigate: a text-only site or one that has a crisp layout and rich, visually appealing content to inform your purchases? Like most people, you probably agree that the rich visual experience is much preferred, but with one condition: that it doesn’t get in your way and interfere with whatever activity you are doing.
Numerous studies have concluded what we all know instinctively: that more and higher-quality images lead to higher user engagement and greater conversions:
-
Forrester Research has noted a 75% increase in user expectations for rich content and images on websites and applications: users demand images!
-
eBay notes in their seller center that listings with larger images (>800 px) are 5% more likely to sell.
-
Facebook observes 105% more comments on posts with photos over those without.
-
Eye-tracking studies done by Nielsen Norman Group also conclude that users will engage most of their time with relevant images when given the chance.
Users pay close attention to photos and other images that contain relevant information but ignore fluffy pictures used to “jazz up” web pages.1
Jakob Nielson
Adding graphics and photos in your web or native applications is easy. There are bountiful tools that help you edit photos and design graphics. It is even easier to embed these images in your websites and have full confidence that these images will display just as you intended.
The volume of images being served to end users is growing at an astonishing rate. At the time of writing, Akamai serves over 1,500,000,000,000 (1.5 trillion) images each day to the people on this planet—not including the use of favicon.ico. More incredible is that both the quantity and size of these images are increasing at an astonishing rate. If you sit still and stare at your smartphone I’m sure you will almost be able to see the images grow before your eyes.
Arguably the number of humans on the Internet has also increased at a staggering rate. In the same time that we have added over 600 million people to the Internet and over 1 billion smartphones, the collective web has also doubled the volume of images on an average web page (Figure 1-1). In just three years, according to HTTP Archive, the average image has grown from 14 KB to 24 KB (Figure 1-2). That’s a whopping 1.4 MB per web page. This average assumes that users visit sites with the same distribution as HTTP Archive’s index. The reality is that users visit sites with more images more frequently (particularly social media sites). This means that an average visited website likely has a much higher volume of images.
Only font growth outpaced image growth, both driven by superior layout and design. Curiously, many of the most common fonts used are icon fonts—images in disguise.
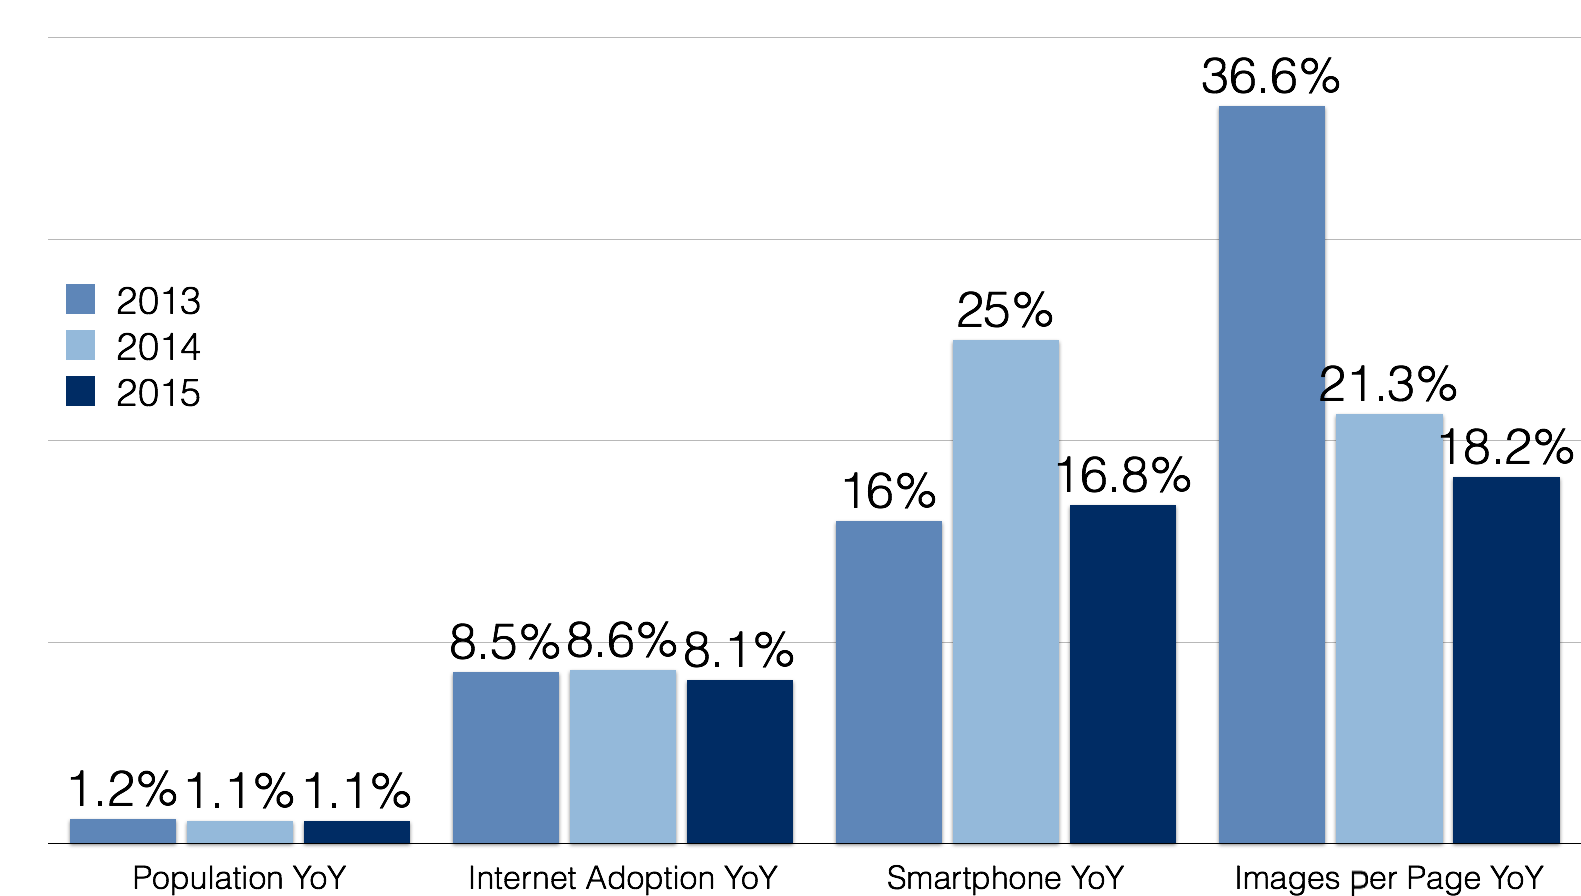
Figure 1-1. Growth rate year-over-year
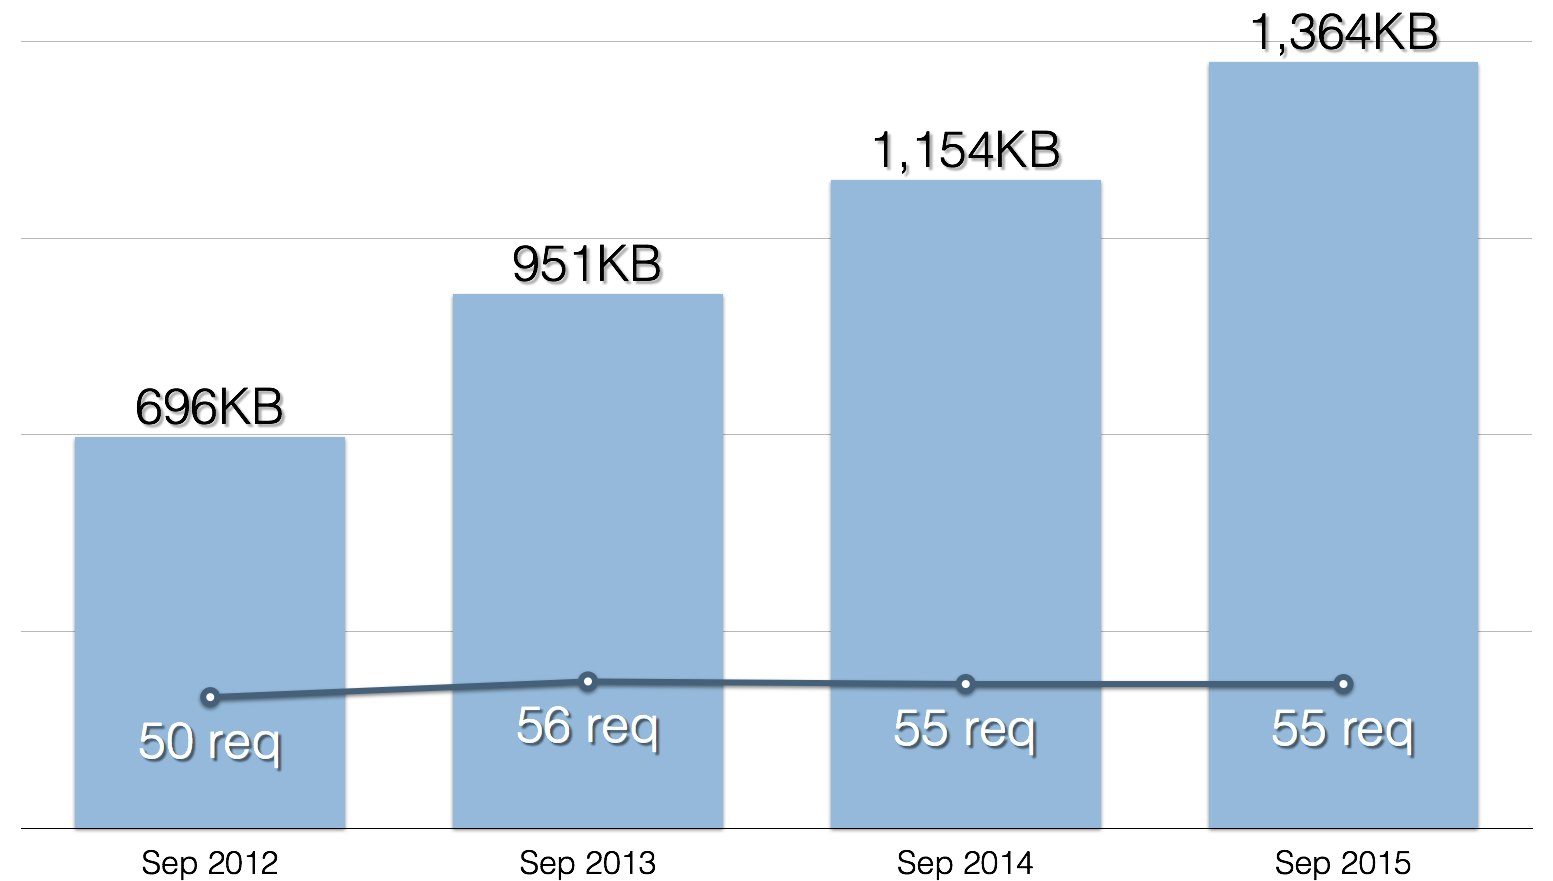
Figure 1-2. Images have doubled in size from 2012 to 2015
Not surprisingly, images make up 63% of the average web page download bytes (Figure 1-3). Interestingly this hasn’t changed much as a percentage over time.
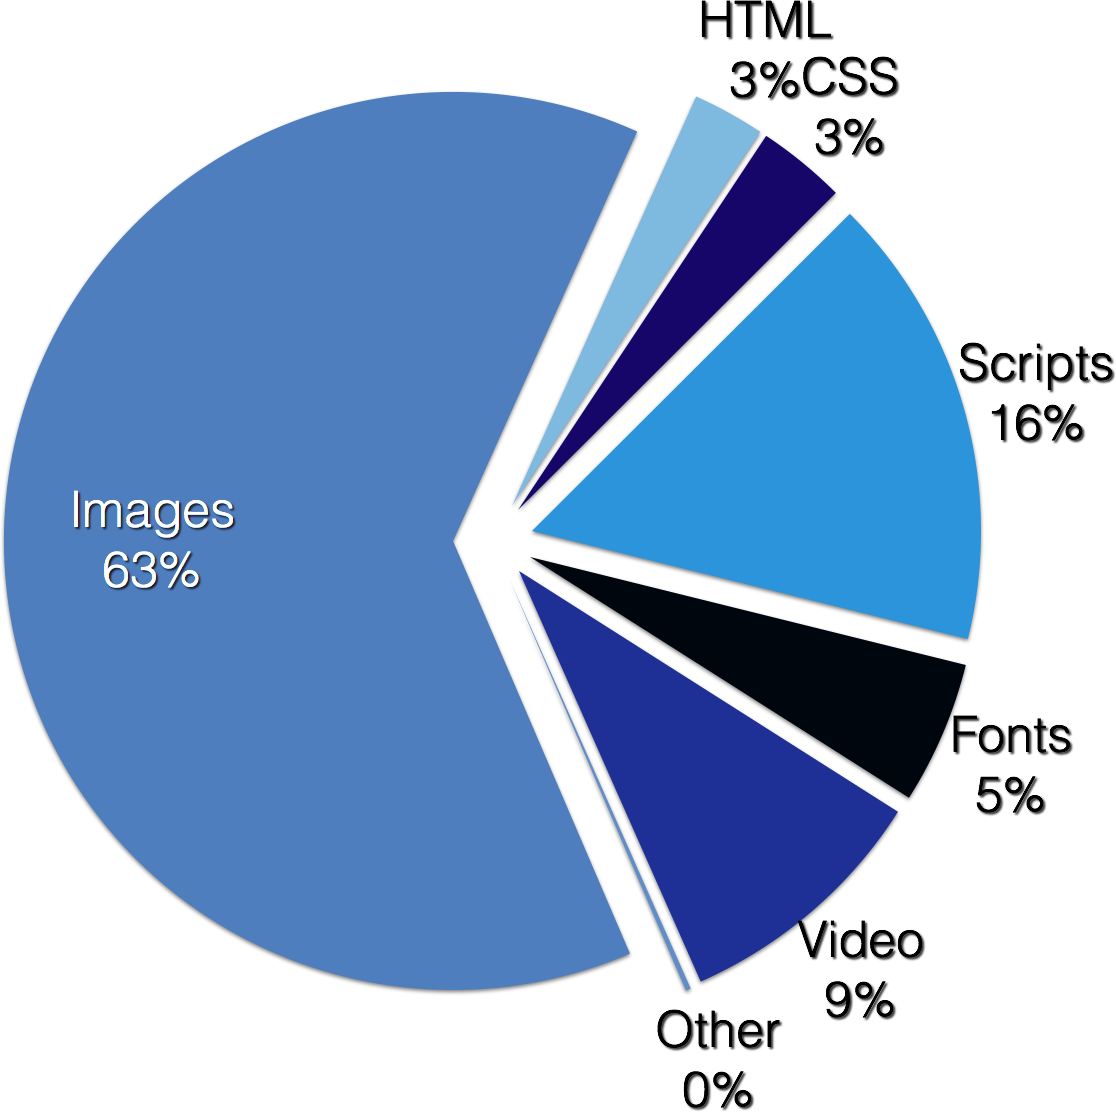
Figure 1-3. HttpArchive.org web page composition (2015)
What About Mobile Apps?
So far we’ve talked about the impact of images on web pages, but what about mobile and native applications? On the surface, mobile apps, like those on Android and iOS, appear different. Yet they suffer from the same challenges as the browser and web pages.
Apps can differ from websites: apps pre-position their images by containing them in a packaged archive like an .ipa or .apk. On the other hand, the image formats and image loaders that modern smartphones use are standing on the shoulders of the same technology that browsers have evolved to use. Even apps that don’t load over the network are concerned about how quickly they can load and display on the device.
Many apps, like unit converters or offline games, are not network aware. Yet there are many other apps, including news, shopping, and social media apps, that do depend on network access for rich content like images. In fact, since most of these apps don’t have to send JavaScript and CSS like their web page counterparts, the number of images as a percentage of traffic is just as much a concern. Consider a recent profiling of the CNN application. In an average session (reading headlines and one article), you see a similar breakdown in content types (Figure 1-4).
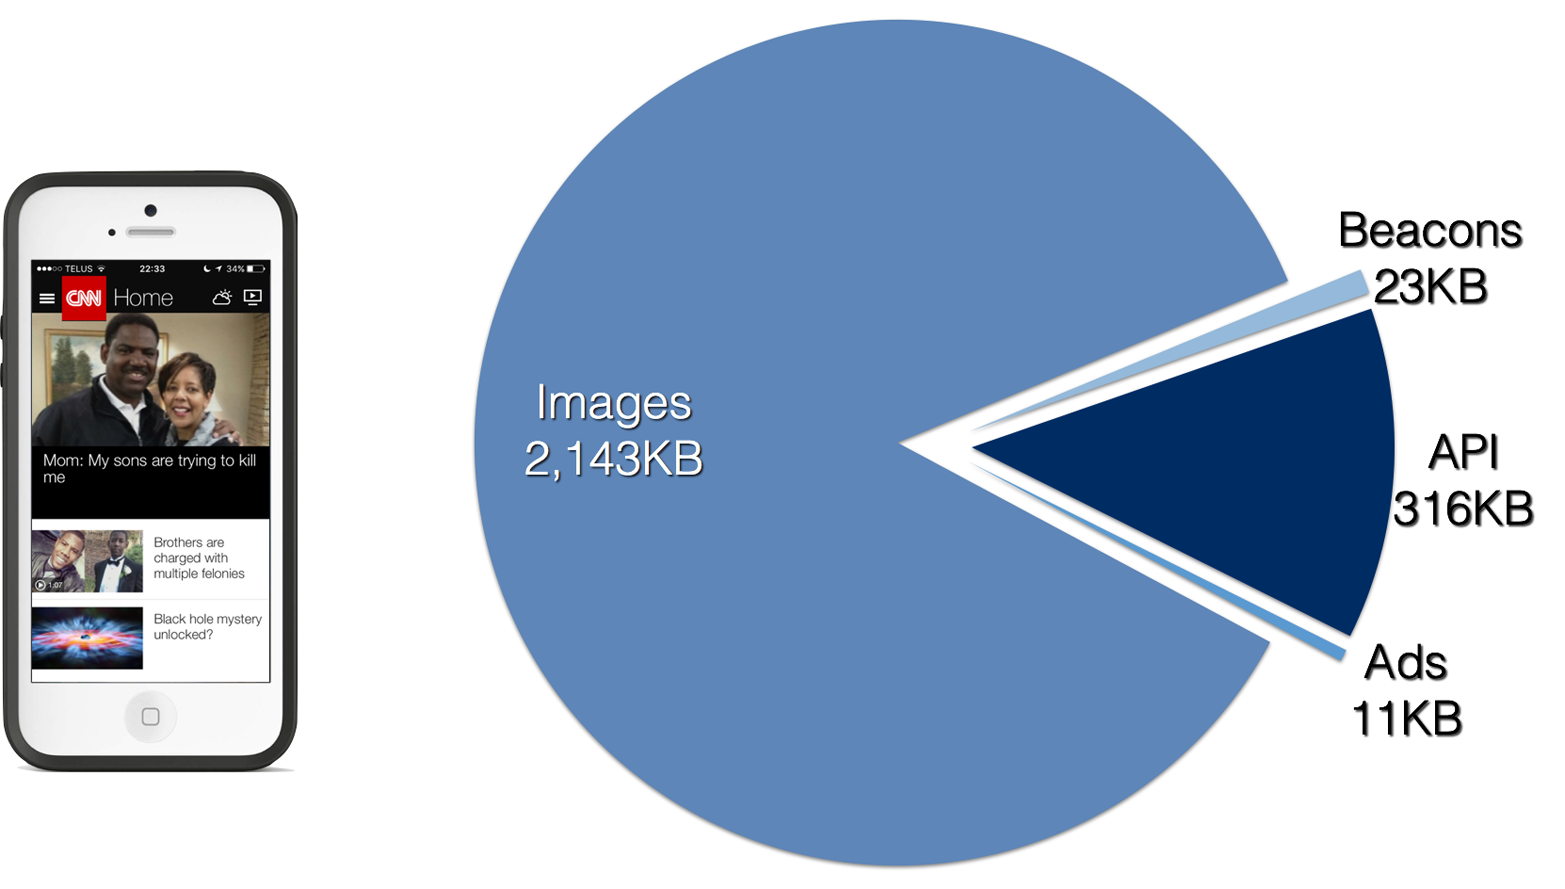
Figure 1-4. Content breakdown on the CNN mobile app
Speed Matters
It can’t be said enough: speed matters! Numerous studies have shown the impact of web page performance on your business. Faster websites increase user engagement and revenue and can even drive down COGS (cost of goods sold). Conveniently, WPOstats.com maintains an up-to-date repository of these studies and experiments (Figure 1-5). The bottom line is that the faster your web page is, the more money you’ll make.
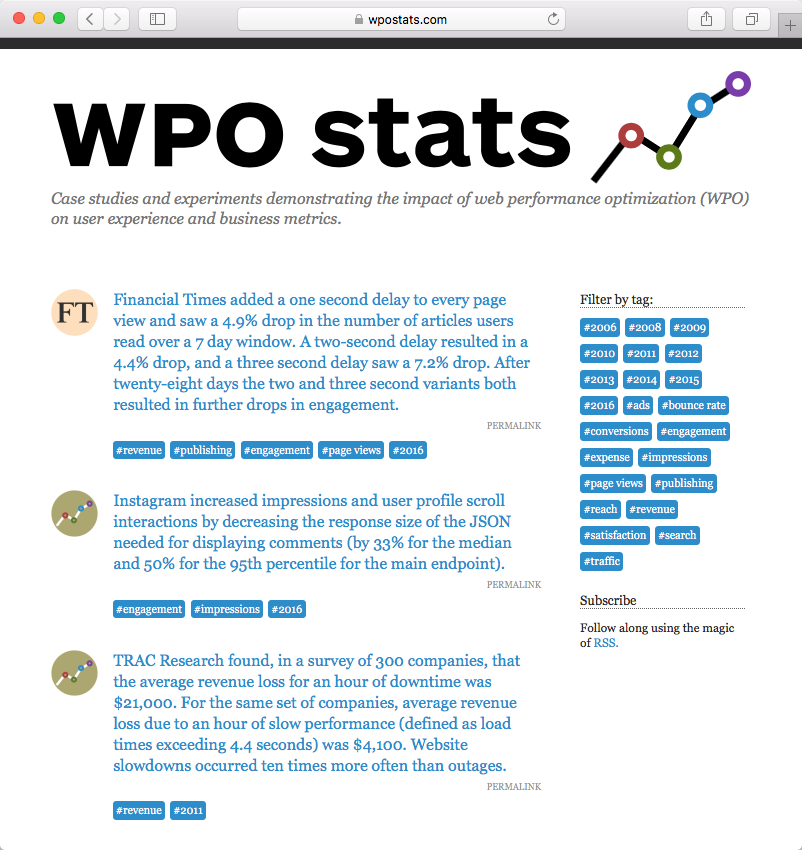
Figure 1-5. Case studies and experiments demonstrating the impact of web performance optimization (WPO) on user experience and business metrics
Fortunately, modern web browsers use preloaders to rapidly discover and download images (though at a lower priority compared to more important resources). Additionally, image loading doesn’t block the rendering and interaction of a web page. Similar techniques are available for native apps as well.
The average Internet connection is ever increasing in bandwidth and decreasing in latency. This is good news for loading web pages! The downside is that it isn’t growing as fast as images or user demand. Even more challenging is that a growing percentage of web traffic happens over cellular connections. Consider that cellular is ultimately a shared medium. There is only so much spectrum and you share it with the people around you on the same tower. Even as each generation of cellular technology emerges, the new bandwidth discovered quickly erodes as more people utilize the new technology. OpenSignal conducted a study in 2014 of the average LTE connection in the UK. As you would expect, early adopters of LTE started happy, but within a year were probably grumpy because every tween was eating away at their precious bandwidth capacity.
Do Images Impact the Speed of Websites?
Despite browser optimizations to load images in the background, network performance can impact not just the loading of the images proper, but also the loading of the web page itself. If we removed all images from the top 1,000 websites, these sites would load 30% faster on average over 3G (Figure 1-6). I sure hope those images weren’t important to selling the product. Clearly we don’t want to turn off images and return to the days of the Lynx browser.
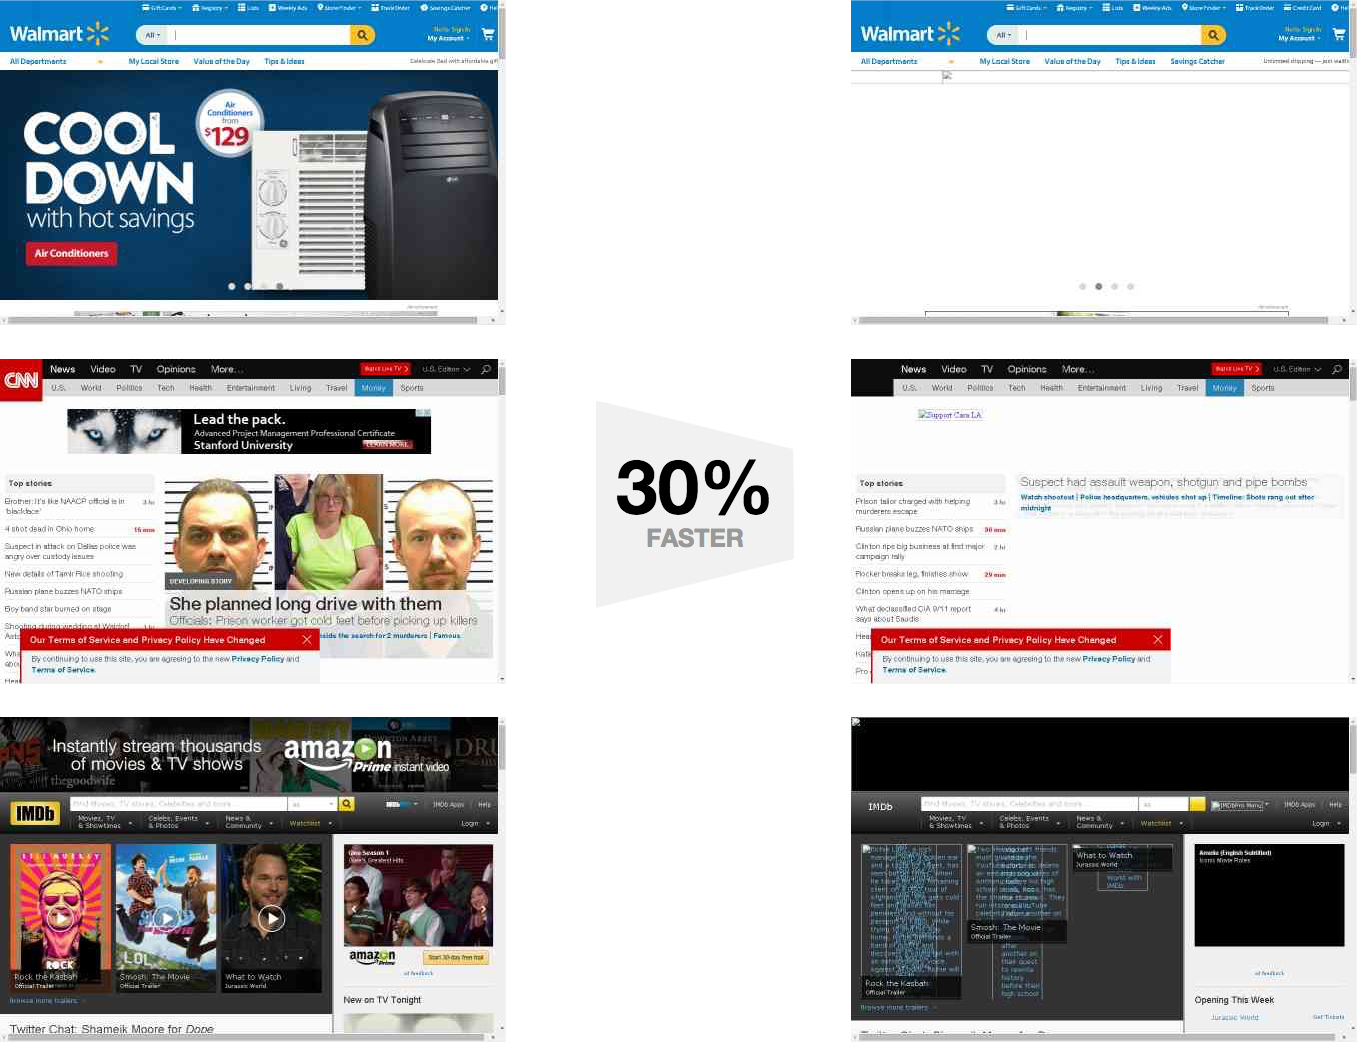
Figure 1-6. Websites without images load 30% faster on average over 3G
Beautiful images and rich interfaces add value; they are clearly not going away. Fortunately, there are many techniques and methods to improve performance of this rich content. Before we dive into the options, it is important to understand the scope of the problem we are charged with solving. To do this, we need to step into our wayback machine.
Lingering Challenges
The following chapters will explore how to balance the highest-quality image with performance—specifically, how to select the right image size for the device and for the network. This is no simple task. We have many formats to choose from with different techniques to optimize for high performance. Complicating this further are the network conditions. How do we factor in latency or low bandwidth when deciding what to serve a user to give the best experience? And what about our Infrastructure and Operations teams, who have to deal with the complexity of the many images now stored, processed, and included in their disaster recovery plan? There are many factors to balance to deliver high-quality images.
Get High Performance Images now with the O’Reilly learning platform.
O’Reilly members experience books, live events, courses curated by job role, and more from O’Reilly and nearly 200 top publishers.

