Chapter 4. Measurement Tools
We already know what to measure when we are talking about web performance. The next step is to understand which tools available on the market will help us with measurements on mobile web engines.
Remote Inspectors
One of the most useful tools for us are remote debuggers or remote inspectors. They allow us to connect a desktop browser’s tools with a mobile counterpart to do analysis and profiling and get reports from a mobile device. This is particularly useful when measuring things that will be different from the desktop’s viewport or that are network-dependent (and therefore using a real phone to test the user experience makes a difference).
Note
The RemoteDebug project is an open initiative to bring interoperability between different browser vendors and different developer tools. It’s still in the early stages, so in the meantime we will have to use the developer tools available on each platform.
Safari on iOS
If you have a MacBook or a Mac desktop computer and an iOS device, you can remotely debug websites, home screen web apps, and hybrid applications on the iOS Simulator and on actual devices.
Warning
Unfortunately, at the time of this writing, there is no way to open the iOS web debugger from a Windows or Linux desktop computer. We must rely on other nonnative solutions if we need to debug from a non-Mac desktop computer.
To use the Web Inspector on iOS, you must first enable it from the iOS device (it’s enabled by default on the Simulator), by going to Settings→Safari→Advanced and turning on the Web Inspector feature, as seen on the right in Figure 4-1. Then, you need to connect your device through USB to your desktop computer.
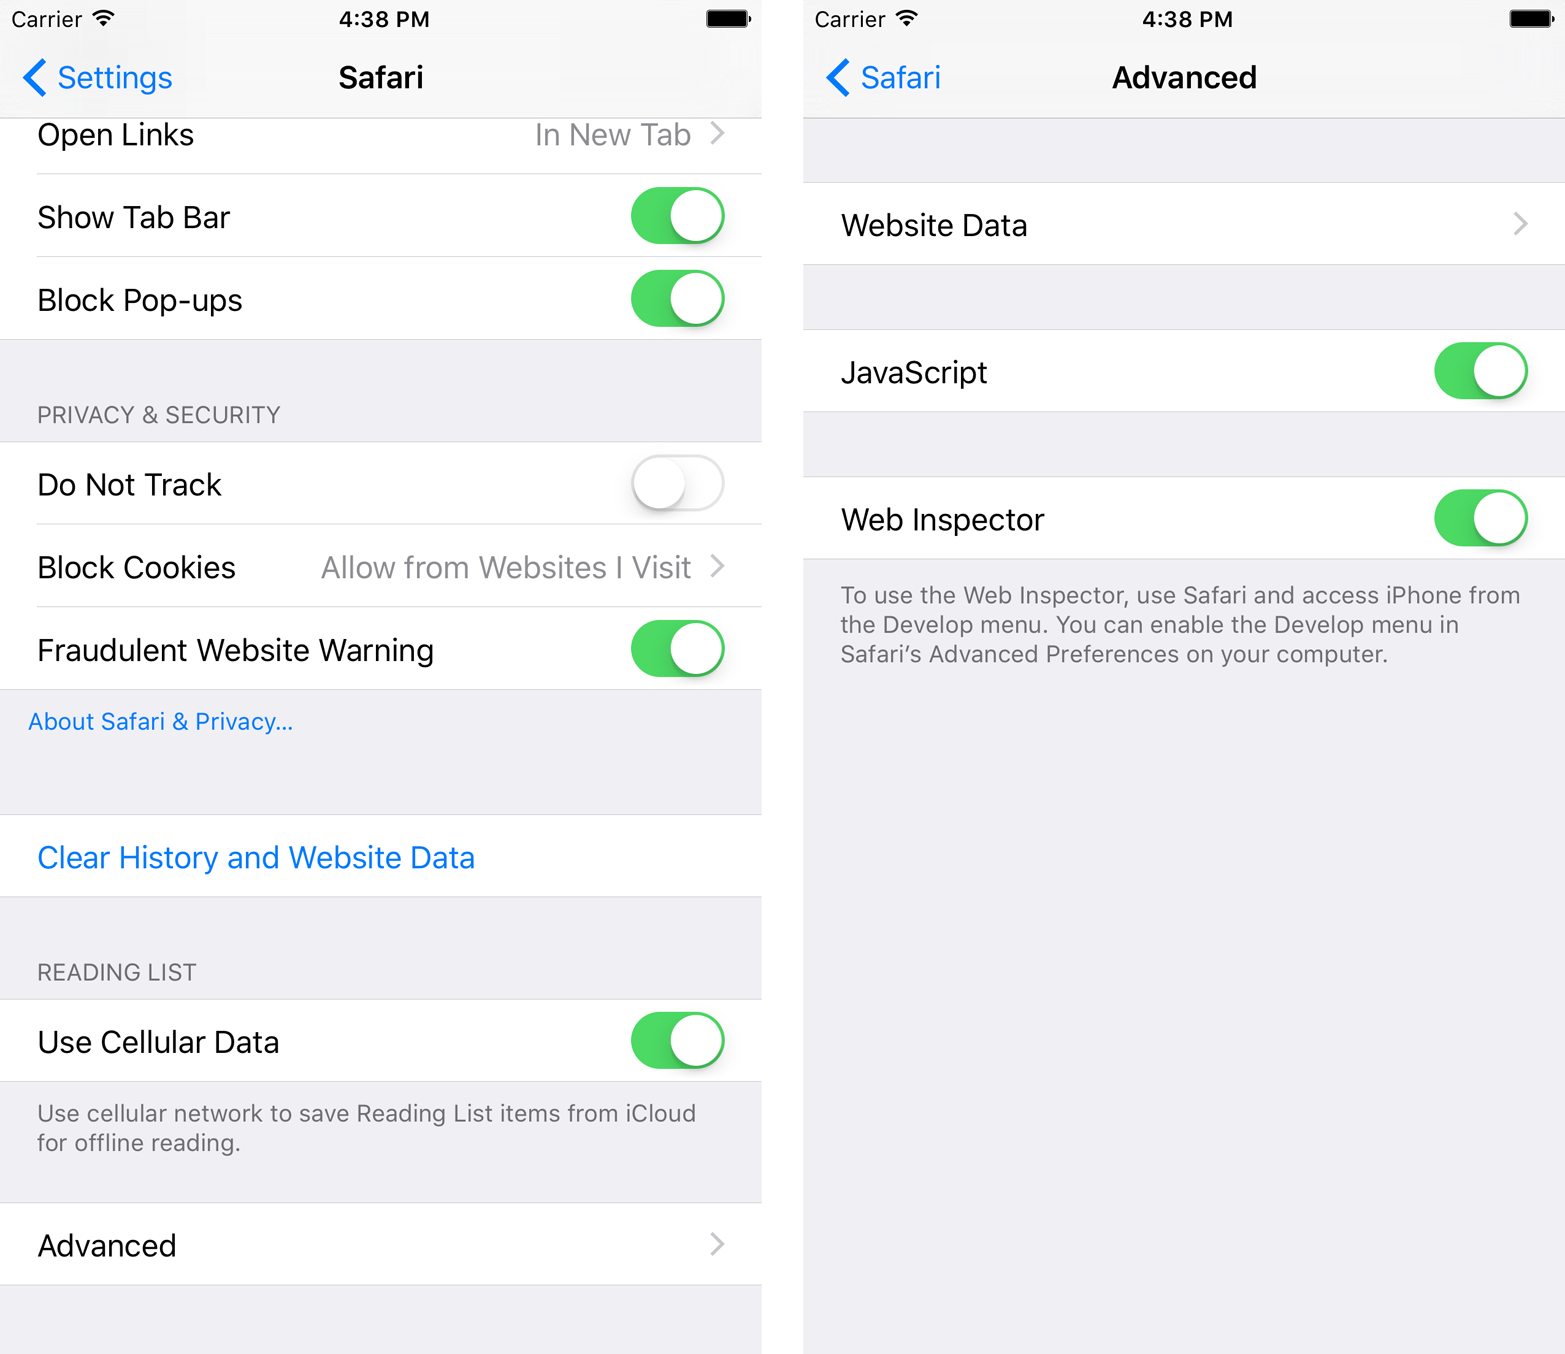
Figure 4-1. On iPhones, iPod touches, or iPads you can enable the Remote Web Inspector from Settings to start measuring performance on your actual device
The next step is to enable the developer tools in Safari for Mac, via Preferences→Advanced→“Show Develop menu in menu bar.” When you’ve done all this and the session you want to debug is open on the device or in the Simulator, you can access the Develop menu in Safari for Mac; in that menu, you’ll see the name of your device as a submenu with all the available web sessions to connect to on it, as seen on the right in Figure 4-2.
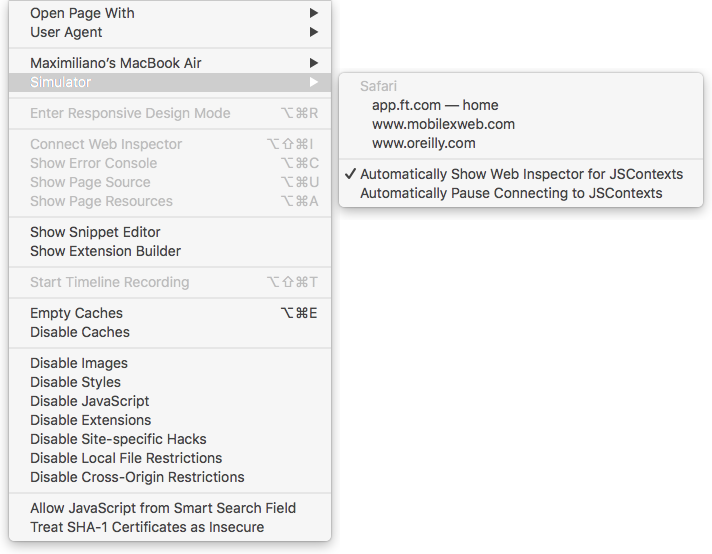
Figure 4-2. Once you have a Simulator or an actual device with Web Inspector enabled, you can see all the available sessions ready to inspect, from Safari, a web view, or a home screen web app
When you’re connected, Safari for Mac will open a window with your debug session user interface (as seen in Figure 4-3).
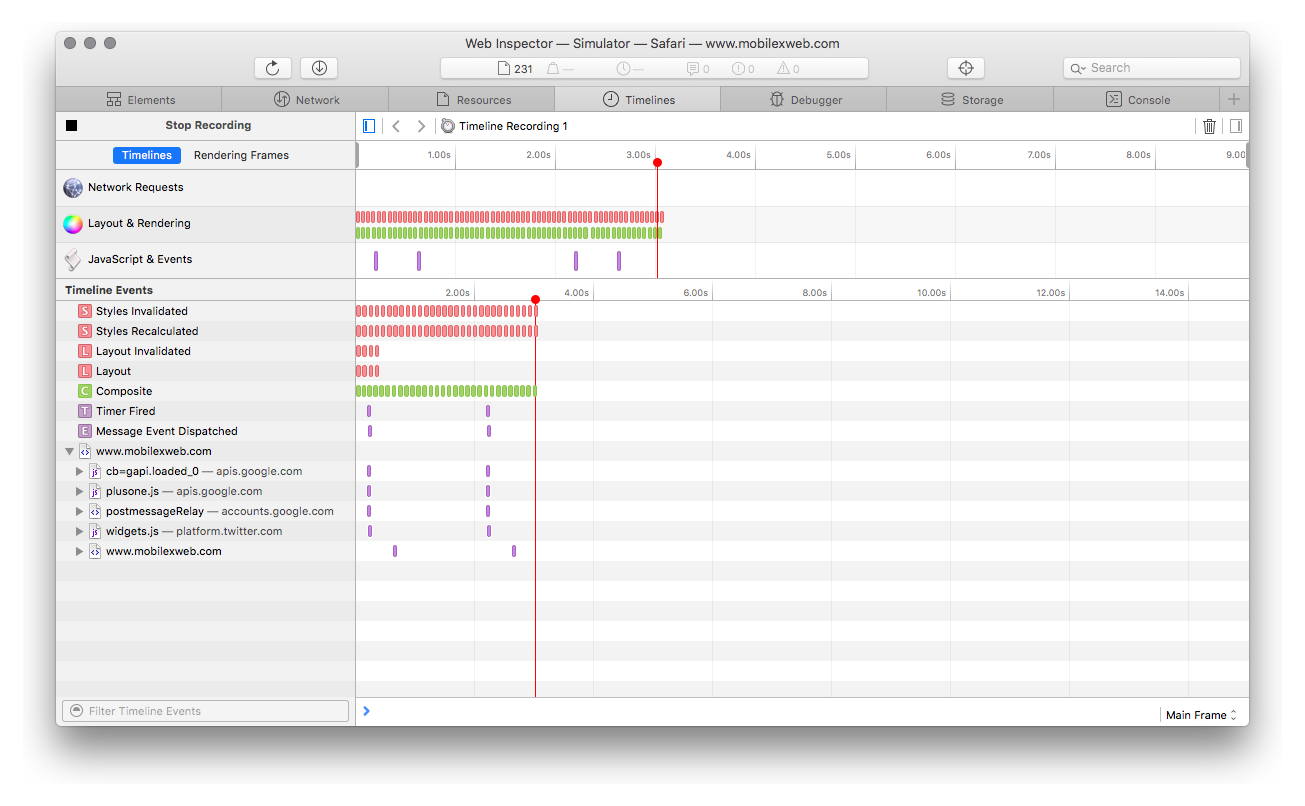
Figure 4-3. The Web Inspector on Safari 9+ looks like this when connected to a remote session from an actual device or the iOS Simulator
In the debug session, you will be able to:
-
Inspect the HTML, CSS, and JavaScript
-
Browse storage, inspecting cookies, local storage, SQL databases, and more
-
Record and measure timelines, including network requests, layout and rendering, and JavaScript execution and events
-
See network requests
-
See warnings and errors
-
See web workers (threads)
-
See and manage JavaScript breakpoints, including watch expressions
Warning
We can connect a Remote Web Inspector to a web view running inside a native app only when the app was installed in debug mode—that is, it’s our app and we are installing it from Xcode. Therefore, if you have an app that was installed from the App Store and it’s using a web view, you won’t be able to connect the Inspector to it.
Timelines
The Safari Web Inspector has different options available depending on the desktop’s Safari version, such as Safari 8 on macOS 10.10 (Yosemite) and from Safari 9 on macOS 10.11 (El Capitan).
The section of the Web Inspector that matters to web performance is the Timelines tab, though we can also get useful information from the Network tab. There is a record button at the top left of the screen that we can use to start profiling a website or web app.
Note
It’s better to stop the recording after you have collected the information you’re looking for, such as after the page has loaded. It’ll help the analysis of the results if the timeline is static (not changing, and not adding more items while recording).
There are three timelines available, providing information about different areas:
- Network requests
-
All the network communication, including initial loading, lazy resources, and other calls after the
onloadevent. - Layout & Rendering
-
All the paint, layout, and CSS operations
- JavaScript & Events
-
JavaScript code being executed by the runtime, as well as events being fired by the DOM
Warning
While we can make do with only using the analysis from the iOS Simulator, it’s always a good idea to check real performance on actual devices. Some features, such as real cellular network conditions or touch feedback, can only be experienced with actual phones or tablets.
Once you have a recording dump on the screen, you will find several colored bars over the timeline. If you scroll up or down (using the mouse wheel or a touchpad gesture) over the timeline, you will be able to zoom in or out in the timeline.
If you select a region in the timeline, you will see a detail view in the lower section of the screen. Each row will represent one entry (e.g., one downloaded resource or one paint operation).
You can filter the list of entries from the selected region by using the search box in the bottom-left section and/or clicking on one of the timeline names, such as “Network Requests” or “Layout & Rendering.” To remove a timeline filter, just click on the “X” at the right of the timeline’s name.
Starting with Safari 9 on macOS El Capitan, the timeline can be replaced with a different mode: Rendering Frames. Instead of seeing events in the timeline, you will see a representation like that in Figure 4-4: a frame-based, task-specific view of existing profiler/instrumentation data. The data is displayed in three sections: an overview graph (top left), a records table (main), and a summary chart (top center and right). If you have a performance issue, you can see frame by frame what the engine is doing and find the bottleneck. You can read more about the new Rendering Frames mode in the WebKit Blog.
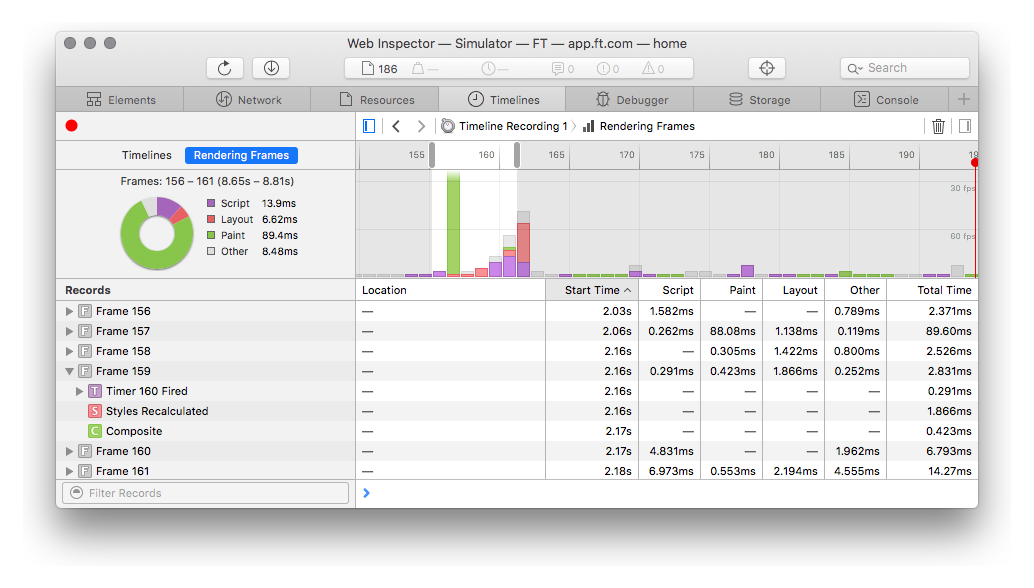
Figure 4-4. From macOS El Capitan with Safari 9, the Web Inspector has been redesigned, including a new Rendering Frames view that allows us to detect frame drops or problems keeping the frame rate consistent
Network tab
From macOS El Capitan, Safari offers a redesigned Network tab where we can see all the resources in list mode, as shown in Figure 4-5. We can’t see them in a waterfall chart. You can filter by name, by resource type, or by document (main document or iframes available).
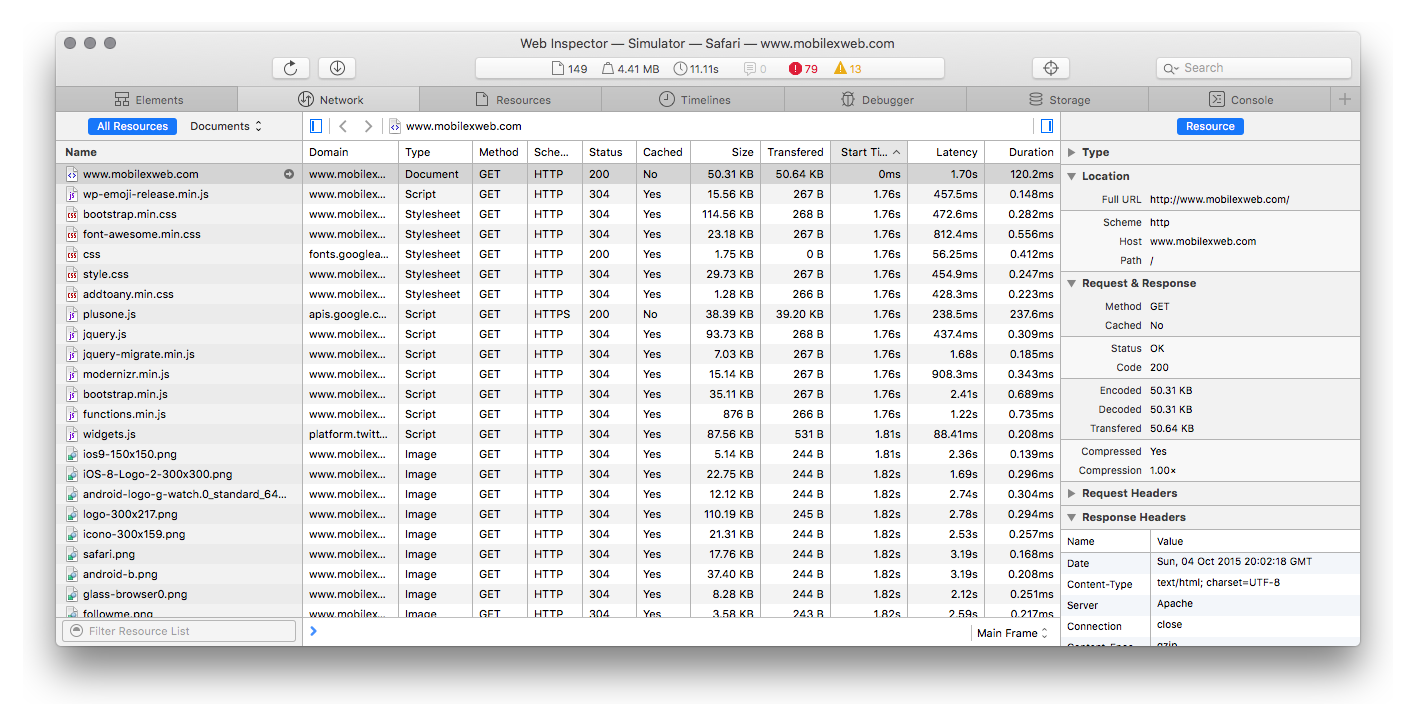
Figure 4-5. The Network tab will list the resources and the details of each one, including timing information. When you open the tab for the first time, you might need to refresh the page. To do so, you don’t need to go to your device; you can use the reload button on the desktop interface.
Note
The iOS WebKit Debug Proxy allows you to connect an iOS device or simulator to the Google Chrome Developer Tools on macOS or Linux. It acts as an experimental proxy translating Apple WebKit’s debugging protocol to the one that is used by Chrome. A Windows version has been ported, and Firefox also has its own solution based on these proxies that enables you to use Firefox Developer Tools with iOS, known as Valence.
Chrome for Android
Google Chrome for Android supports remote debugging through a USB connection using the Developer Tools available in Chrome for desktop.
To use the Remote Inspector, follow these steps:
-
Enable USB debugging on your Android device (see the instructions in the sidebar that follows).
-
Connect your mobile device to your desktop using USB. If your host is a Windows-based computer, you will need debug USB drivers from the manufacturer; see Android Studio’s list of OEM Drivers.
-
Accept the RSA key fingerprint on your phone (it gives the right permission to your desktop computer).
-
Open Chrome on your desktop and type “chrome://inspect” in the address bar, or select More Tools→Inspect devices from the Chrome menu in Developer Tools.
-
Select the “inspect” link that matches your device’s name and web session from the list (see Figure 4-6).
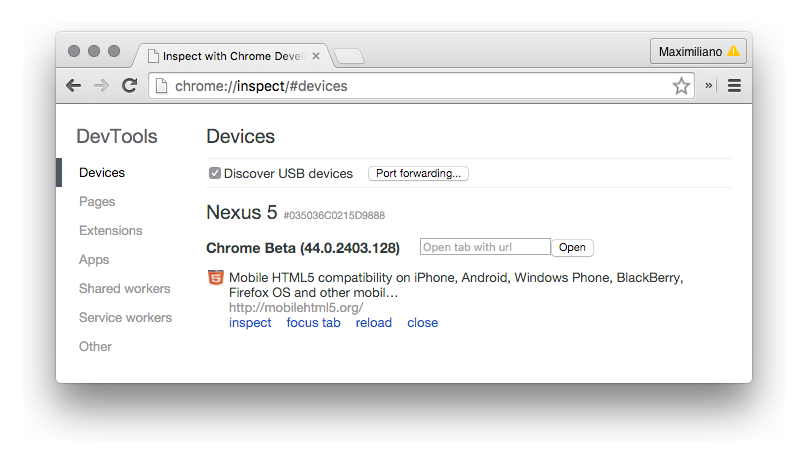
Figure 4-6. When connected with USB debugging enabled, you will be able to see and inspect websites and home screen web apps using Chrome for Android, as well as Chromium-based web views in apps in debug mode
Warning
In Google Chrome for Android, Web Inspection is automatically available after you enable USB Debugging mode on your phone. Enabling USB debugging mode and accepting the host computer allows anyone connecting your phone with a desktop computer to access most of the stuff on your device.
When connected, you can use the Chrome Developer Tools as usual to do all of the following:
-
Inspect elements
-
Access the resources list, including local storage, and SQL and IDB databases
-
Access network information
-
Add JavaScript breakpoints and use debugging tools
-
See useful timelines, such as rendering information
-
Profile JavaScript code
-
See the console and execute JavaScript code on it
Warning
Google Chrome for desktop has an emulation mode that you can use without a phone connected through USB. You can use this mode to get information from Developer Tools, but for performance issues you need to remember you are using your desktop browser and not the Android version of it.
Screencasting
When you connect your Android device’s Chrome or Chromium-based web view, Chrome on the desktop allows you to do a screencast. With screencasting enabled, you can see and interact with your mobile web content from the desktop (see Figure 4-7). Therefore, you can leave your phone on the table and work on the desktop while executing everything on the phone.
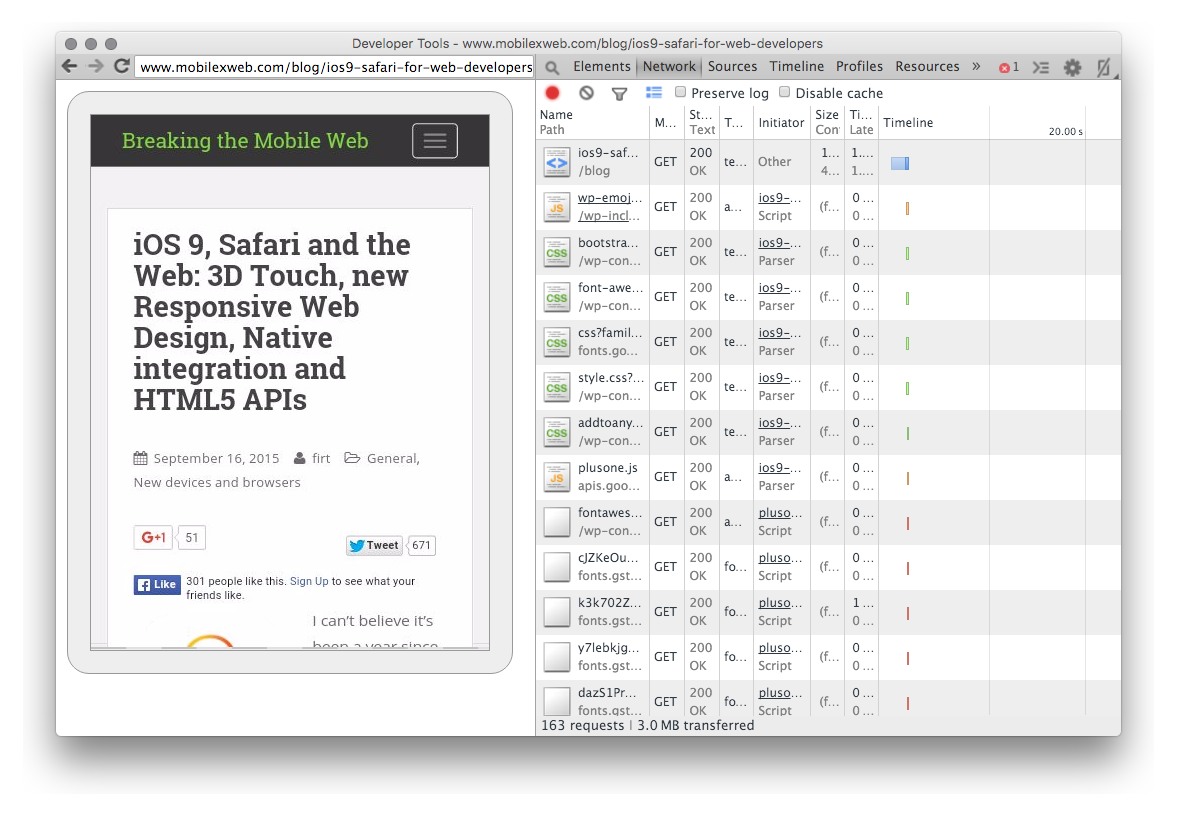
Figure 4-7. When connected to a device using a modern version of Chrome or Chromium-based web view, you can enable the Screencast feature (the phone icon at the top right position of the inspector). The screencast is also interactive, so you can click, scroll, and type on your desktop and it will be translated to the device.
Rendering settings
Chrome Developer Tools has several not-so-visible rendering options that will help you a lot when measuring performance and understanding bottlenecks under Rendering Settings.
To define advanced rendering settings, you need to open the drawer in the Developer Tools pane (using the Escape key or the console icon in the DevTools pane). The drawer has several tabs; the last one is Rendering, as we can see in Figure 4-8. The first important option here is “Show FPS meter.” This will add a layer in your actual device (not in the screencast) with live information about the current frame rate, CPU, and memory usage so you can touch, scroll, and interact with your web content and see when it’s dropping frames (see the right side of Figure 4-8).
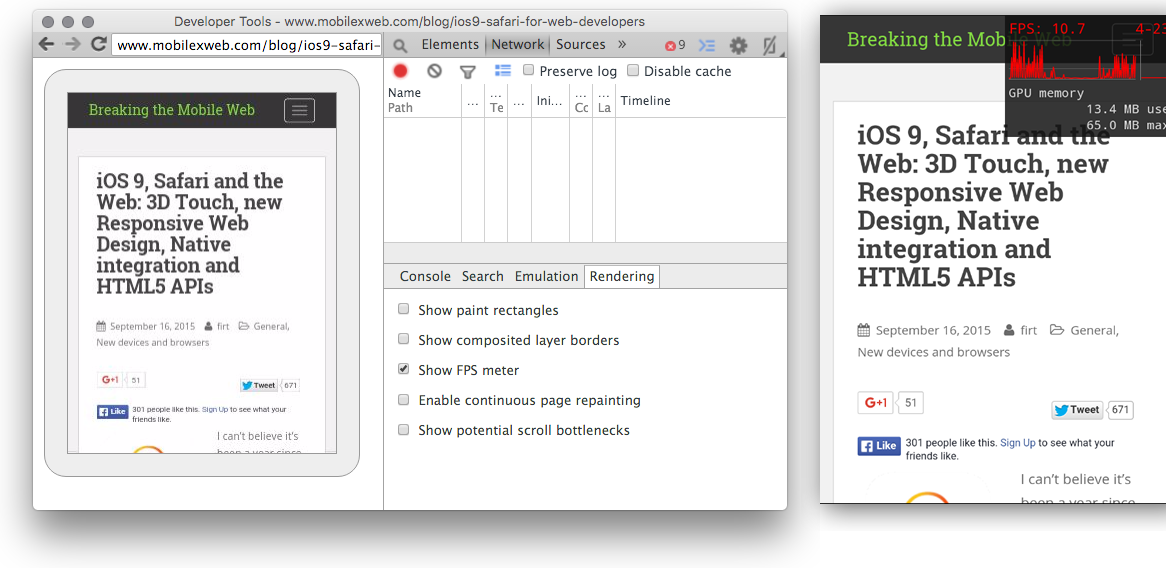
Figure 4-8. “Show FPS meter” lets you see a frame rate graph on your device to find responsiveness problems
“Continuous painting mode” will force a repaint on each frame. It lets you find rendering issues such as content that is taking too much time to render and might decrease your frame rate or harm the scrolling experience. For example, you can select “Enable continuous page repainting” and start adding or removing CSS properties (such as shadows, transforms, and filters) and see if the graph goes up (it takes more time to render) or down (it’s faster). The smaller the rendering time, the greater the frame rate you will get. In Figure 4-9, we can see this in action on a test suite available at http://ariya.github.io/css/glowingtext. It creates an animation with glowing text so you can see the peaks in rendering time that the animation takes at some points.
“Show paint rectangles” and “Show composited layer borders” will help you understand how the browser is rendering your content on the screen and it will let us find better ways to design it from a video acceleration performance point of view.
Finally, “Show potential scroll bottlenecks” will highlight in your web content which areas will slow down scrolling. More information about this option is available in a GitHub discussion.
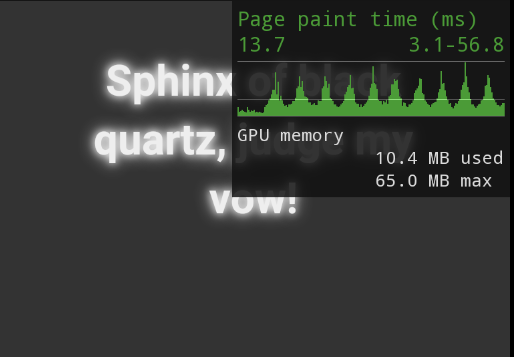
Figure 4-9. With continuous painting mode, we can compare different implementations, styles, and code to see which options take less rendering time. The graph shows page paint time; the bigger the value, the worse from an FPS point of view
The Network tab
The Network tab is where you will find the list of resources and detailed information about each request, including timings, headers, and response bodies.
By default, the requests are not recorded, so after you go to the Network tab for the first time, you will probably need to refresh the page on your mobile device to get all the information. You need to verify that you’re recording (the record button is red), and you will probably want to stop the recording after the page has loaded if you are just measuring loading times. You can disable the cache to make a full first page load.
Note
The Remote Inspector UI will change based on the actual Chrome or Chromium version installed on the device.
If you don’t stop the recording, then any Ajax request, advertisement, or script that is updating information after the load will continue modifying the chart while you are analyzing it.
Figure 4-10 shows the UI of the Network tab and the most important sections and buttons on it.
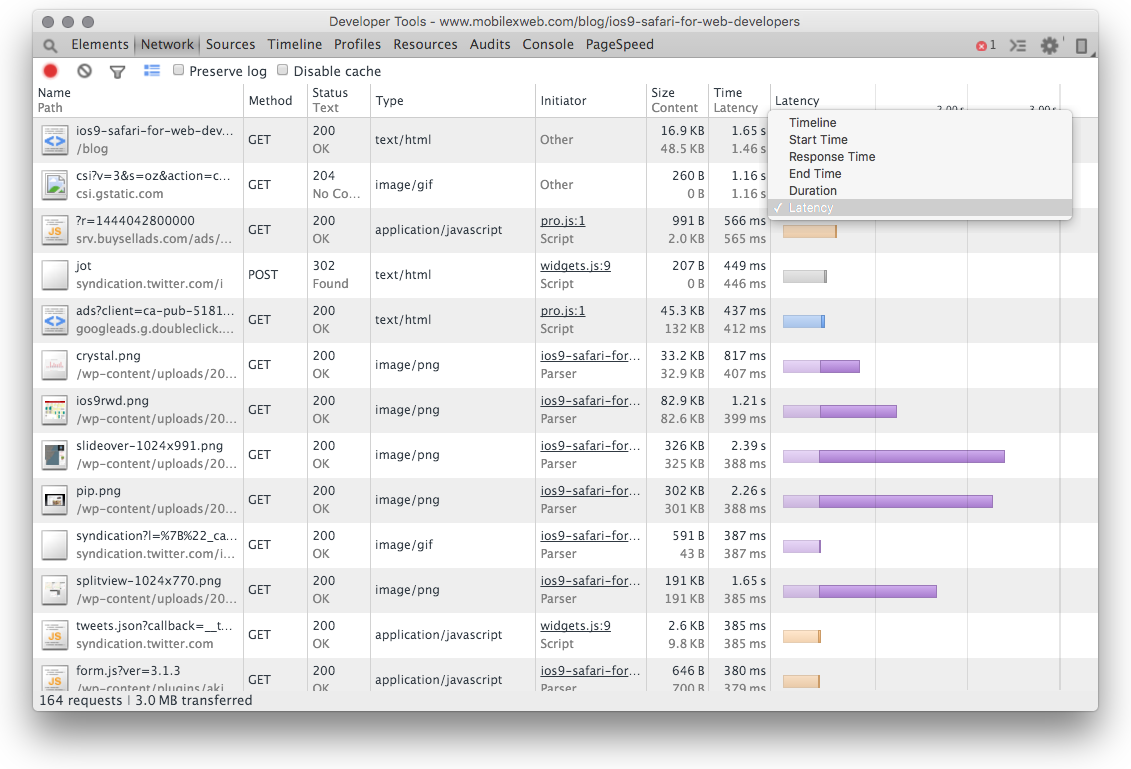
Figure 4-10. The Network tab will show you all the requests being made by the current page. You can order by columns, and if you click on the seventh column, you can select various options, from timeline mode (mini waterfall chart) to latency graph. Also, right-clicking on any column will let you customize that column.
If you click on one of the colored bars in the Timeline column, you will get detailed information about timings for that particular resource, as you can see in Figure 4-11.
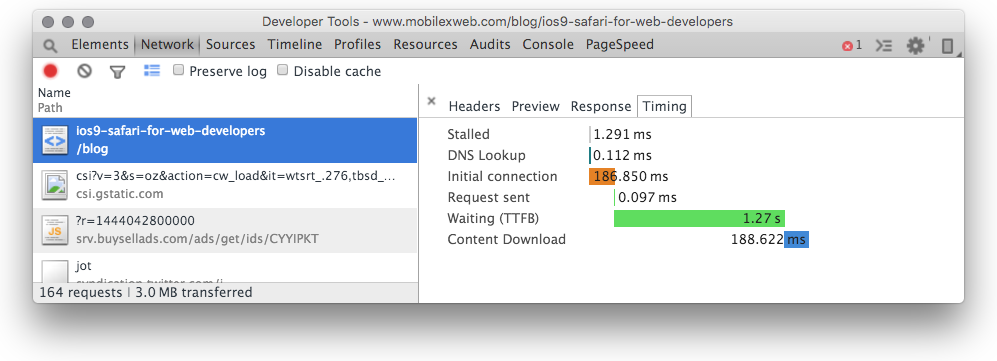
Figure 4-11. If you click one of the resources, you will have a details pane available with headers, a content preview, and timing information
In Figure 4-11, a new measure appears in gray: Stalled. This is the amount of time that the request waited before it could be sent. The delay includes proxy negotiation and the amount of time that the browser waited until a TCP connection was available for reuse.
Warning
If, like me, you have been playing with web performance optimization for a while, you probably have a Page Speed tab in your Chrome Developer Tools pane. That tool is now deprecated and has been replaced by the online tool Speed Insights. If you want to remove it, you can do so from chrome://extensions.
The Timeline tab
The Timeline tab is a mixed profiling window where you can see, all at the same time, what is happening in JavaScript (Events mode), memory (Memory mode), and paint operations (Frames mode) and what the user is seeing at that point through screenshots.
It’s one of the most complete and complex profiling tools available today in the web world. For more information, consult the documentation.
Note
If you right-click on the Timeline, you can save the data for future analysis in JSON format.
The Profiles tab
The Profiles tab lets you record and profile:
-
JavaScript and CPU usage
-
Heap snapshots (lets you see the memory’s content at one particular point)
-
Heap allocations (lets you see the memory’s evolution over time)
You start by selecting which report you want to create and start recording. When you are done, you stop it and the report will be generated. You can get a summary, specific reports based on your profile, and a statistical chart if you use the top drop-down menu (Figure 4-12). You can save each data collection for future analysis.
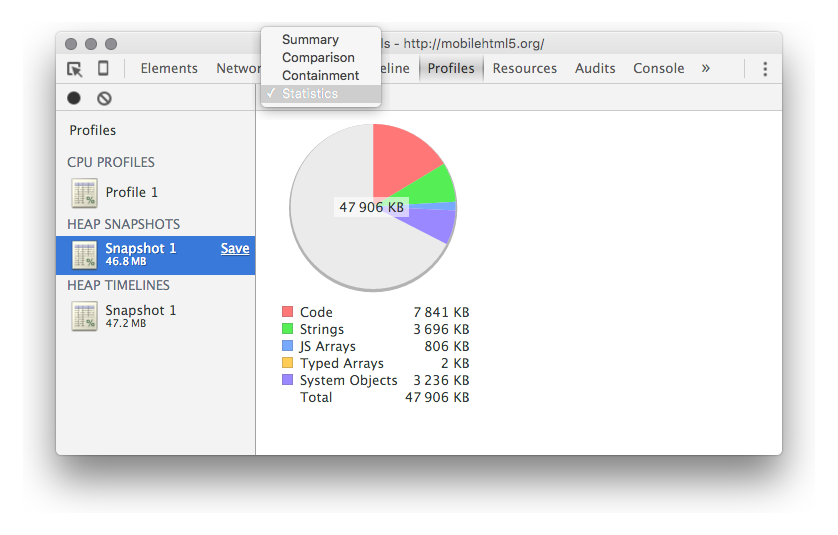
Figure 4-12. If you want to profile memory or CPU usage, the Profiles tab will make the reports for you
The Audits tab
Audits is a basic tool for performance analysis. It will make an analysis of your network usage and it will give you a report and suggestions to improve performance. This tool has been superseded over time by other solutions that we will cover later. Therefore, it’s not too important today.
Internet Explorer and Edge
Both Internet Explorer and Edge come with the F12 developer tools (F12 is the key shortcut to open them). These include the Network tool (Ctrl-4), the Performance tool (Ctrl-5), and the Memory tool (Ctrl-6).
The Network and Memory tools work similarly to comparable tool in other browsers, so we’ll focus on the features available in the Performance tool in Edge.
To start working with the tool, you first need to start a profile recording a performance session. You should do stuff while recording, such as loading the page, scrolling it, or touching UI elements. The report will include a ruler showing performance milestones such as DOMContentLoaded, and if you are using the User Timing API you will see your marks there, as shown in Figure 4-13.

Figure 4-13. In the F12 dev tools in Edge, we can record a profiling session and then see performance milestones in the ruler, including User Timing marks
The timeline will show CPU usage and frame rate over time, and you can get detailed information on what was happening at one particular time or during a range if you select it from the timeline, as we can see in Figure 4-14.
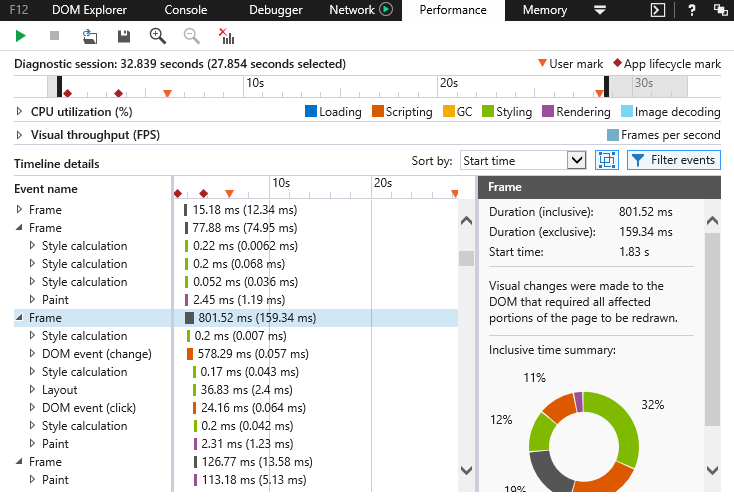
Figure 4-14. The “Timeline details” section has completed information for performance measurement and for finding bottlenecks in Edge on Windows 10
To give you information about responsiveness, Edge will show details about HTML and CSS parsing, HTTP requests, speculative downloads, requestAnimationFrame calls, DOM events, script evaluation, timer execution, media query listeners, mutation observers, garbage collector execution, rendering, and image decoding. That level of detail should be enough to find any problems’ causes after seeing a suspicious range in the timeline (such as a CPU usage peak or FPS meter drop).
Vorlon.js
Vorlon.js is a remote debugging solution created by Microsoft that helps you remotely load, inspect, test, and debug JavaScript code running on any device with a web browser. You can even connect up to 50 devices and debug all of them at the same time.
It involves a Node server, a script you need to inject, and a desktop tool. Because it’s a JS-based solution, its scope for profiling and performance measurement is limited, and it’s basically restricted to a Network tab.
Proxies
When a browser does not offer any developer tools, such as Android Browser, Samsung Browser, or Nokia Browser, the only thing we can do is work with the network layer. There are several tools that will let you sniff the network and create waterfall charts from network requests from any device that is using a particular connection or proxy.
With proxies, you can only create waterfall charts and see network details. As there is no connection to the phone or the rendering engine, you can’t use these tools for Speed Index calculation, filmstrip generation, or responsiveness measurements.
Setting Up on Android
Because the usage of proxies is more suitable for older or non-Chrome Android browsers, let’s see how to set up a proxy on an Android 4.x device.
Go to Settings→Wi-Fi and long-press the WiFi network that has visibility to your desktop computer; then select “Modify network” and enable advanced options. In the proxy settings, you need to select Manual and type in your desktop computer’s local network IP address and proxy port, as in Figure 4-15.
Warning
When using a proxy to sniff the network, you have to know that these tools are unable to identify the origin of a network request. Therefore, if you have several tabs or apps in the background making requests, they might all get listed in your reports. Some proxies are smarter and will use the HTTP header Referer to group the requests by initial response, but it’s better to reduce network usage on the phone while recording a session.
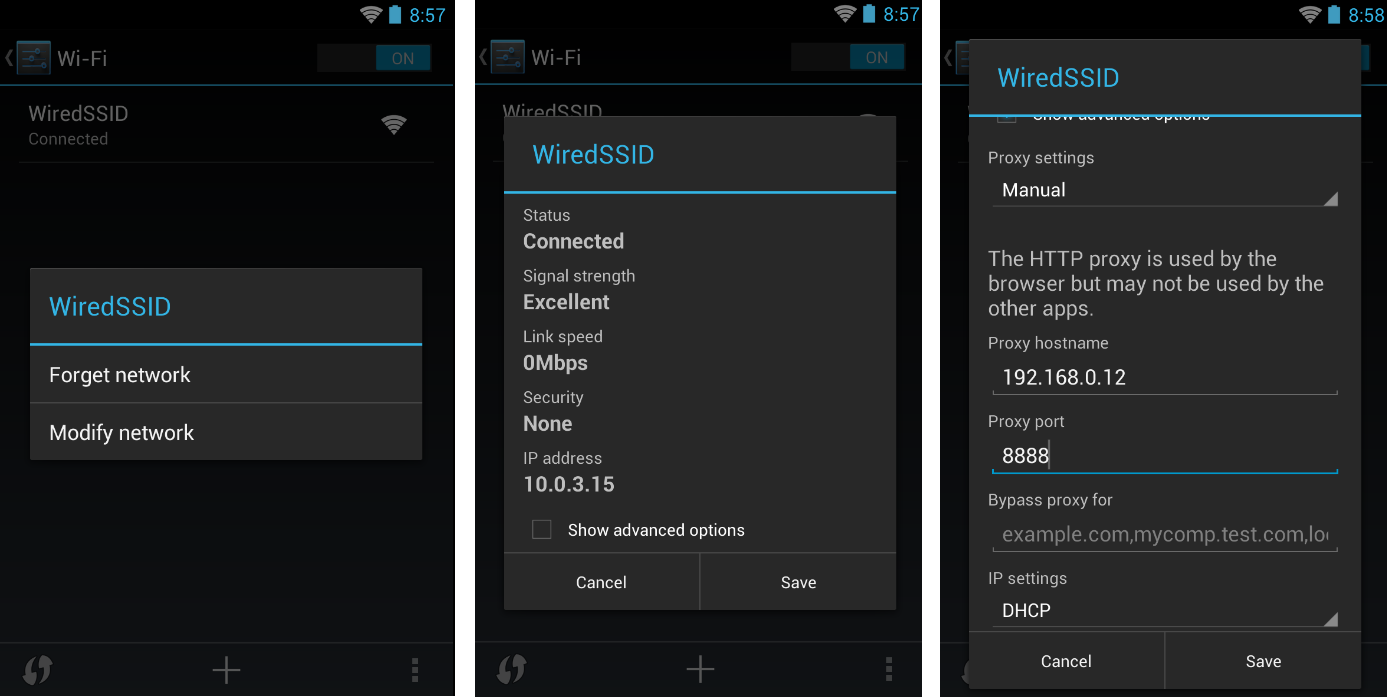
Figure 4-15. On most mobile devices, you can set up the proxy at the OS level. Some browsers allow you to set up the proxy for that browser only.
If you are setting up the Android SDK Emulator for proxy usage, you must use a command-line argument before opening the instance. For details, see the documentation.
Charles Web Debugging Proxy
Charles Proxy1 is a Java-based tool compatible with Windows, macOS, and Linux and optimized for web debugging that will let us see the network and waterfall charts in a desktop-based interface. To use it with a phone, you must connect the phone to a WiFi network with visibility to your desktop computer and set up the proxy with the IP address and port of Charles.
Once Charles is installed, the first thing you should do is disable the desktop proxy. By default, Charles Proxy will try to sniff your desktop browsing, and that is not something we want at this time. To disable it, go to Proxy→Proxy Settings and disable the Windows or macOS proxy (based on your operating system) and the Mozilla Firefox proxy. Then, on the Proxies tab, set the port number (usually 8888, as we can see in Figure 4-16).
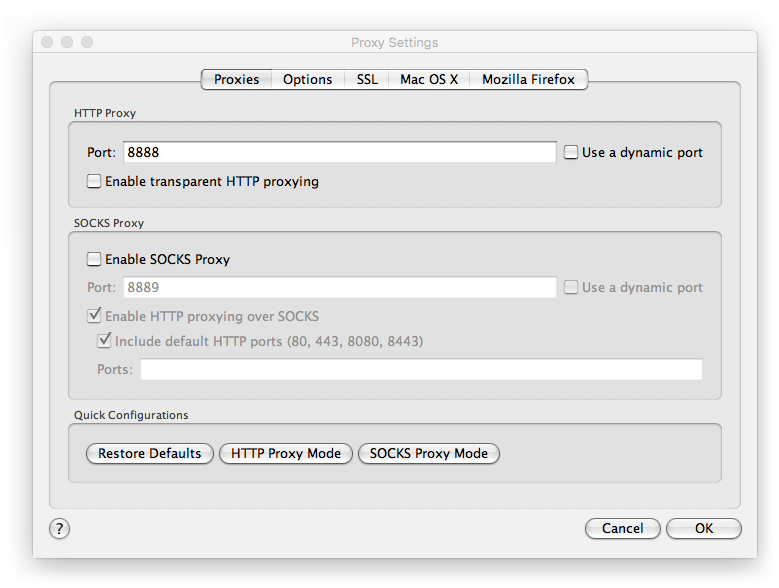
Figure 4-16. With Charles Proxy, you can sniff what your mobile browser is doing if it’s connected to the same network
When you are ready to start and you have your phone connected to your proxy, you are ready to record the session. Select Recording from the Proxy menu or use the toolbar icon and start browsing on your mobile phone or emulator. You need to stop the recording as soon as the page is loaded, because Charles Proxy can’t separate network requests that are coming from other apps or browser tabs.
Fiddler
Fiddler is a web debugging proxy from Telerik, available for Windows only (it was once a Microsoft product). It lets us debug the network layer in any browser, because it sits between the browser and the network. Fiddler has unique features, such as the ability to debug traffic from any country using a Geoedge service and the ability to create scripts in the proxy itself using a scripting language.
There are also add-ons that let you add more power to the tool while sniffing your browsing, such as CertMaker for iOS and Android, which will let you sniff HTTPS traffic on iOS and Android, and Compressibility, which will give you hints on where to improve compression in your requests.
If you want to use Fiddler from a mobile device, you must set up a proxy on your phone.
On-Device Tools
If you are looking for tools that will help you get performance measurements on the device itself, you might be disappointed. That is because, at the time of writing, mobile browsers don’t have the ability to add plug-ins or modules that can attach to the browser and get information. Most tools out there providing on-device performance analysis will probably use the web view, not the real web engine inside the browser. While sometimes this can be good enough, in some other situations the results will be different.
Online Tools
There are several tools available in the cloud that will let us measure performance, find bottlenecks, and get help and advice.
WebPagetest
The most prominent solution is WebPagetest, where you can generate charts and get insights browsing from real browsers on real networks all over the world, as seen in Figure 4-17.
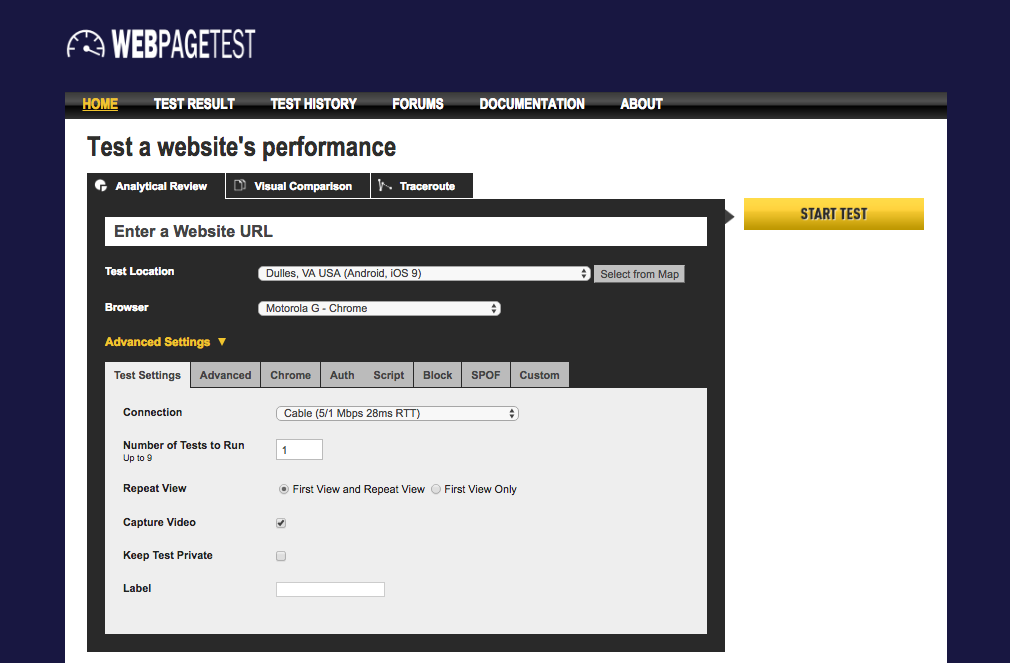
Figure 4-17. Using the free online tool WebPagetest, we can select a mobile device on a real network anywhere in the world and wait just a couple of minutes to get the results
With WebPagetest, we can test our websites on real devices (desktop and mobile) on different real networks all over the world. Several features are available, as we can see in Figure 4-18, including:
-
Standard metrics such as Load Time and Start Render on both first view and repeat view
-
Speed Index
-
HAR file
-
Filmstrip view (see Figure 4-19)
-
Exporting a video with the filmstrip
-
Content breakdown (quantity of files and sizes)
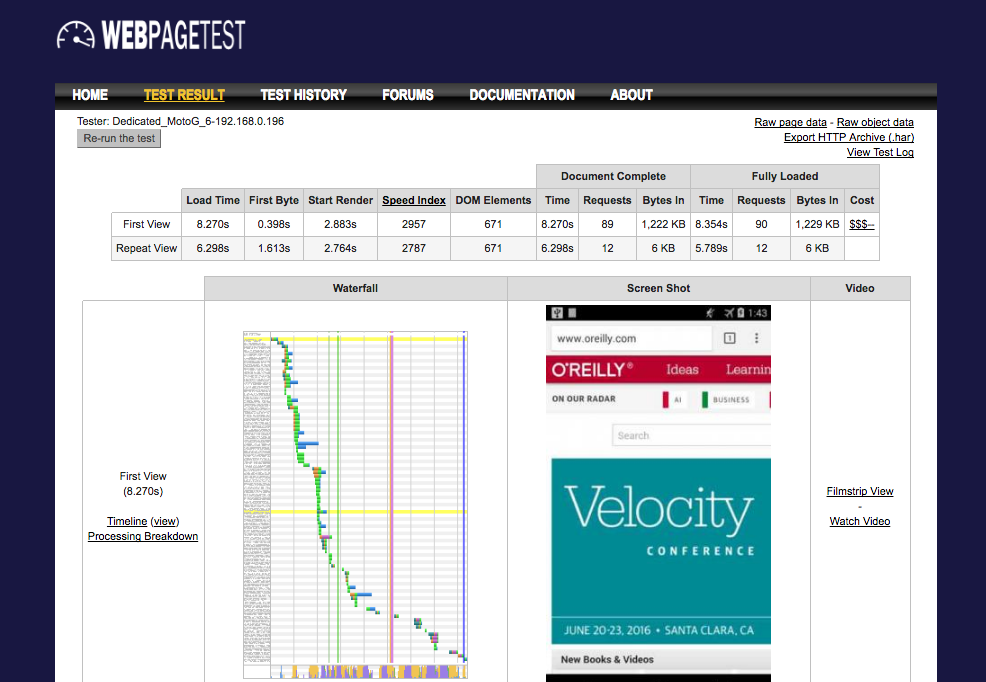
Figure 4-18. With the free WebPagetest service, we can get waterfall charts, CPU and network profiling charts, filmstrip views, page speed, and other metrics
WebPagetest is an open source project and you can run it locally on your own system as a private instance. It also has an API for batch processing, so you can add it to your own testing environment.
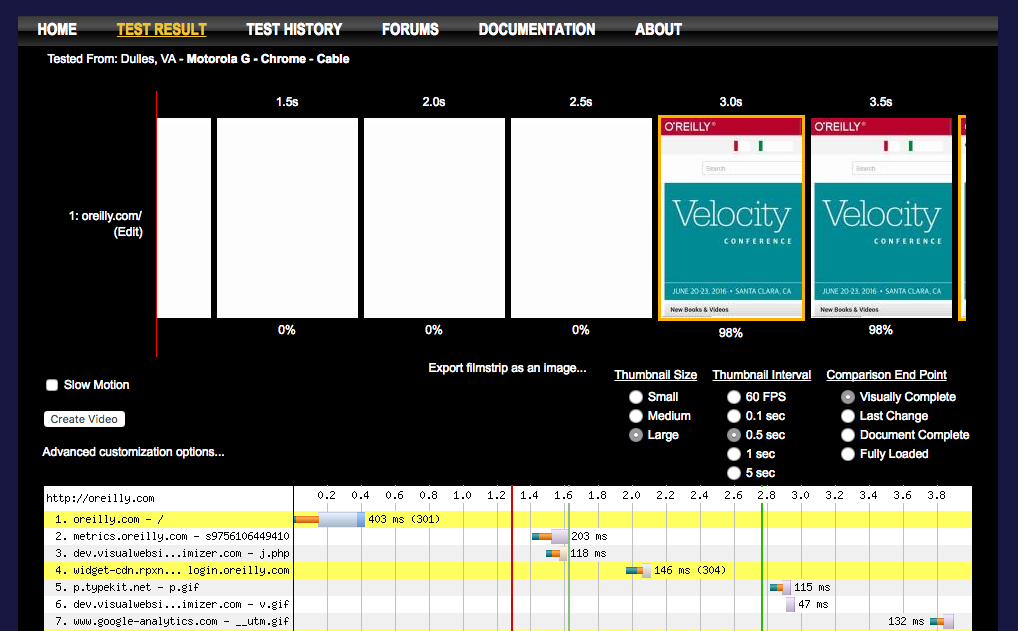
Figure 4-19. With the filmstrip view, we can see how the page looks like at any millisecond matching that timeline with the waterfall chart below
PageSpeed Insights
Google has a free service that will give us conclusions—not charts—about web performance, called PageSpeed Insights.
The tool will analyze your website in both desktop and mobile viewports, giving you hints on what you should do to get better performance. It also gives you a score from 0 to 100 on how well are you performing on both platforms, as we can see in Figure 4-20.
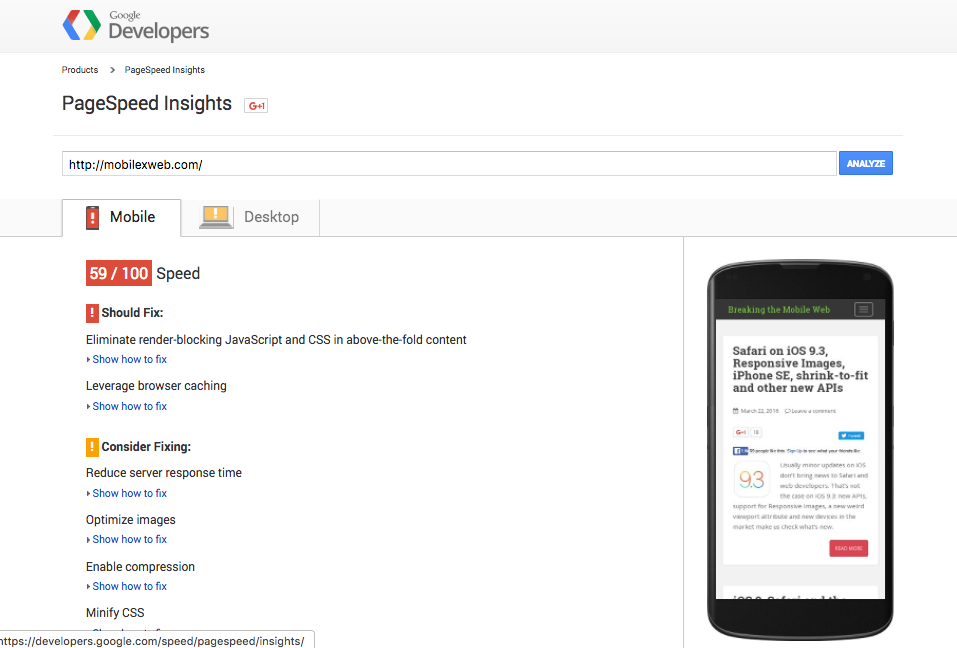
Figure 4-20. With Google’s PageSpeed Insights, we can get quick ideas on how to improve performance and a score indicating how well the website is performing on mobile and desktop
Monitoring Services
Web performance optimization has led over time to a full industry centered on performance. Today, there are hundreds of providers offering performance monitoring services where we can get reports of performance problems from different places in the world. The main providers are:
Another useful service is Show Slow, an open source tool that monitors public websites over time using several web performance metrics. It keeps data for 90 days, and you can see all the stored data on the website.
The Tools You Need
As with every new job, understanding the tools that will be necessary is must-have knowledge. In this chapter, we’ve been talking about several desktop-based tools that can remotely connect to your mobile device and some other tools that might be useful, including:
-
Remote inspectors for Android-, iOS-, and Windows-based browsers
-
Proxies
-
On-device tools
-
Online tools, such as WebPagetest and PageSpeed Insights
In Chapter 5, we will analyze the JavaScript APIs and new HTTP-based specs that will help us in measuring and improving web performance and user perception.
1 There is a 30-day trial version available at https://www.charlesproxy.com.
Get High Performance Mobile Web now with the O’Reilly learning platform.
O’Reilly members experience books, live events, courses curated by job role, and more from O’Reilly and nearly 200 top publishers.

