Chapter 3
Charting the Market with Candlesticks
In This Chapter
![]() Introducing candlesticks
Introducing candlesticks
![]() Going over a few specific patterns
Going over a few specific patterns
![]() Making sense of a series of patterns
Making sense of a series of patterns
Candlestick charting displays the price bar in a graphically different way from the standard bars described in Chapter 2 of Book X:
- They're easy to use and simple to interpret. You can use candlesticks on any chart, with any other indicators, just like standard bars.
- Candlestick names are widely known and suggest other traders will see stand-out candlesticks and react in specific ways.
- Candlesticks are used mostly to identify market turning points, such as a reversal from up to down.
This chapter breaks down the components of a candlestick and covers those candlesticks and combinations that stand out the most from the dozens that exist.
Anatomy of a Candlestick
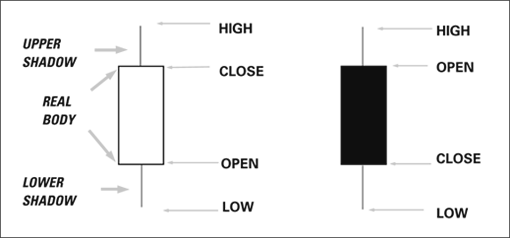
The candlestick form emphasizes the open and the close (see Figure 3-1). The open and the close mark the top and bottom of a box, named the real body. A thin vertical line at the top and bottom of the real body, named the shadow, shows the high and the low.

Illustration ...
Get High-Powered Investing All-in-One For Dummies, 2nd Edition now with the O’Reilly learning platform.
O’Reilly members experience books, live events, courses curated by job role, and more from O’Reilly and nearly 200 top publishers.

