April 2023
Intermediate to advanced
368 pages
10h 19m
English
This appendix describes a partial set of useful probability distributions, suggestions for when to use them, and how to replicate them for simulations in Excel. There is also a spreadsheet on this book’s website with all of these distributions already set up in Excel:
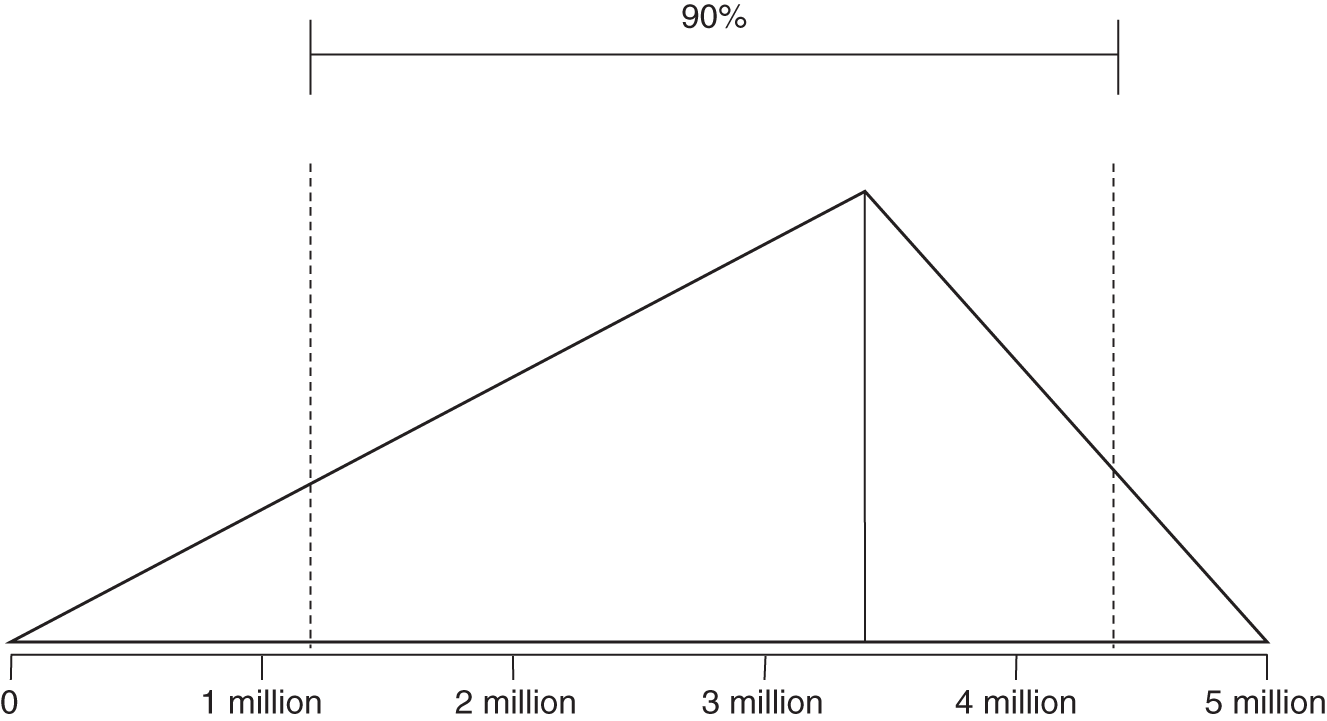
FIGURE A.1 Triangular distribution
Parameters:
Note that UB and LB are absolute outer limits—a 100% CI.
For a triangular distribution, the UB and LB represent absolute limits. There is no chance that a value could be generated outside of these bounds. In addition to the UB and LB, this distribution also has a mode that can vary to any value between the UB and LB. This is sometimes useful as a substitute for a lognormal, when you want to set absolute limits on what the values can be but you want to skew the output in a way similar to a lognormal. It is useful in any situation where you know of absolute limits but the most likely value might not be in the middle, as in the normal distribution.
Read now
Unlock full access


