15.3 Synthetic Image Experiments
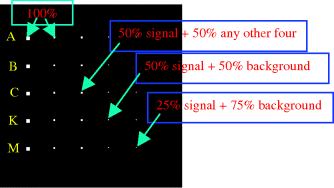
The synthetic image has the five mineral spectral signatures, A, B, C, K, M, marked by circles in Figure 1.12(b) are used to simulate 25 panels shown in Figure 15.1 with five panels in each row simulated by the same mineral signature and five panels in each column having the same size. Among 25 panels are five ![]() pure-pixel panels for each row in the first column and five
pure-pixel panels for each row in the first column and five ![]() pure-pixel panels for each row in the second column, the five
pure-pixel panels for each row in the second column, the five ![]() -mixed pixel panels for each row in the third column and both the five
-mixed pixel panels for each row in the third column and both the five ![]() subpixel panels for each row in the fourth column and the fifth column where the mixed and subpanel pixels are simulated according to legends in Figure 15.1. So, a total of 100 pure pixels (80 in the first column and 20 in second column), referred to as endmember pixels are simulated in the data by the five endmembers, A, B, C, K, M.
subpixel panels for each row in the fourth column and the fifth column where the mixed and subpanel pixels are simulated according to legends in Figure 15.1. So, a total of 100 pure pixels (80 in the first column and 20 in second column), referred to as endmember pixels are simulated in the data by the five endmembers, A, B, C, K, M.
Figure 15.1 A set of 25 panels simulated by A, B, C, K, M.

These 25 panels are then inserted in a synthetic image with size ...
Get Hyperspectral Data Processing: Algorithm Design and Analysis now with the O’Reilly learning platform.
O’Reilly members experience books, live events, courses curated by job role, and more from O’Reilly and nearly 200 top publishers.

