April 2013
Intermediate to advanced
1164 pages
39h 37m
English
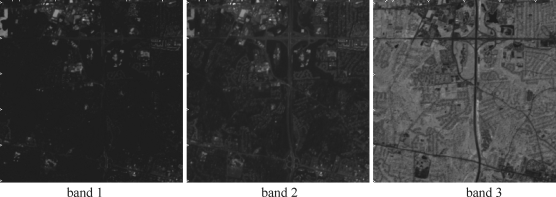
The multispectral image data used for experiments is shown in Figure 31.7. The image scene was collected by the Satellite Pour l'Observation de la Terra (SPOT) system in three spectral bands, two of which are from visible region of electromagnetic spectrum, band 1: 0.5–0.59 μm and band 2: 0.61–0.68 μm and the third band is from near-infrared region of electromagnetic spectrum, 0.79–0.89 μm. The ground sampling distance is 20 m. The image scene has size 256 × 256 was taken over Northern Virginia where in the scene there are the Falls Church High School, the Little River Turnpike, a lake at the upper right corner and the Mill Creek Park.
Figure 31.7 Three spectral band images of SPOT data.
According to the ground truth obtained from visiting the site as well as provided by the Google Earth, there are at least four signatures, buildings, roads/parking lots, water, and vegetation in the scene with training samples selected from the four marked areas shown in Figure 31.8 to represent these four different classes. The signatures used to form the signature matrix M for LSMA were obtained by sample means of training samples from the four marked areas, that is, M = [mlake, mvegetation, mbuilding, mroads] where marea is the sample mean of the area.
Figure 31.8 Training samples selected from four areas in Northern Virginia.
To carry out BEP, two sets ...
Read now
Unlock full access


