Chapter 13. Exporting
Sometimes you need to take your visualization beyond the browser, such as when you’re asked to present your work in a TED talk or in your first solo show at MoMA.
Here are three easy ways to get D3 visualizations out of D3 and into formats suitable for other, noninteractive media. D3 has no explicit “export” function built in (although some people have built their own), so what follows are simple techniques that will work for any SVG image in a web browser.
Bitmaps
The easiest and lowest-quality option is, obviously, to take a screenshot. Depending on your operating system, this can be done using the Print Screen button on a PC, or ⌘-Shift-4 on the Mac. (Drag those crosshairs over the area you want to capture, release, and check your desktop for a PNG image.)
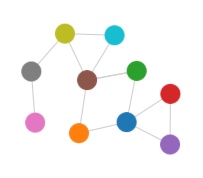
Figure 13-1 is a bitmap screenshot I made using the latter technique.
This is easy and quick, but generates a bitmap image at screen resolution. So, as you can see, the image won’t scale up nicely, nor print with sharp edges. This approach is probably suitable only for reuse on-screen. (The exception to this is if you have a super high-res display, then the resolution will be much finer.)
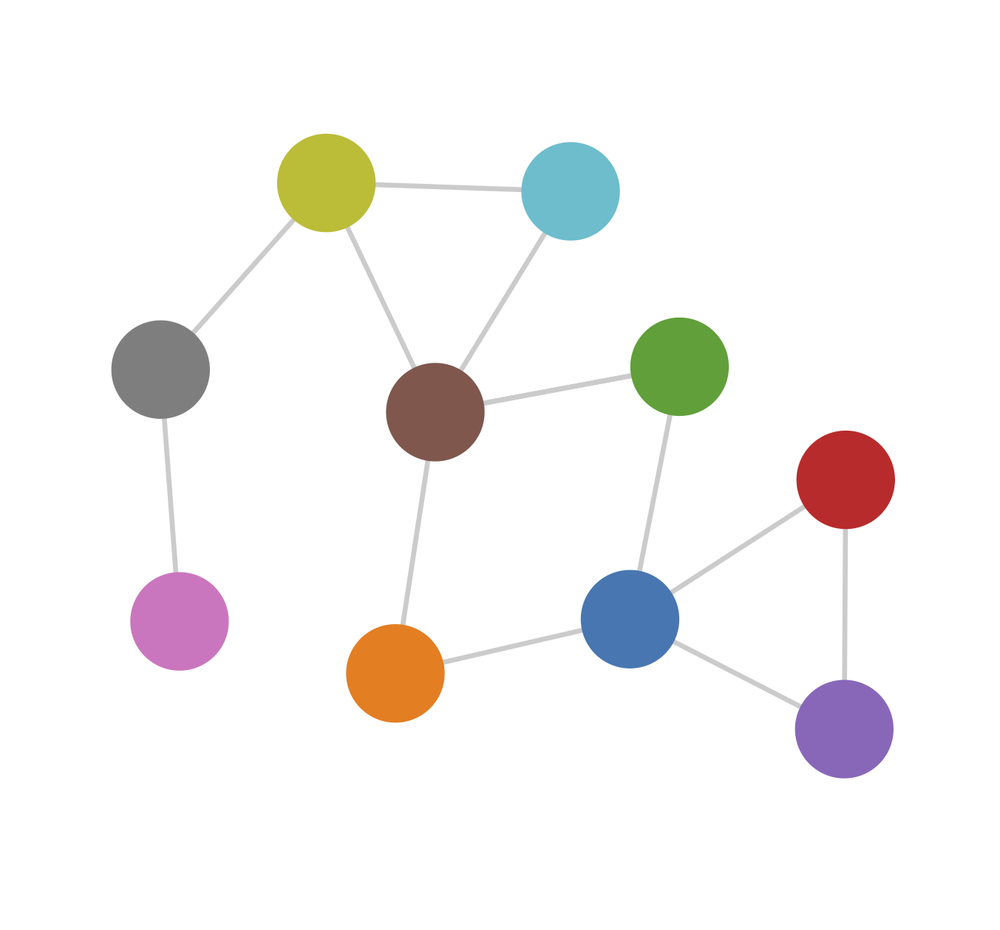
Portable Document Format documents can contain vector-based artwork, such as SVG images, so exporting to PDF gives you a quick, scalable copy of your visualization (see Figure 13-2).
On the Mac, in your browser, go to File→Print. Then look for the PDF menu, and choose Save as PDF.
On Windows or Linux, you might need to install a third-party utility to enable print-to-PDF functionality. (I’ve heard doPDF for Windows works, and it’s free.)
SVG
Finally, it probably occurred to you that, because we are using D3 to generate images in SVG format, why not just save out a copy of the SVG image? This has all the benefits of PDF: You maintain the original vector data, it’s scalable, and you can even bring the results into Illustrator or another SVG-compatible editor and tweak it after the fact. (This is true to a certain extent for PDF files as well, but depending on the PDF generator, sometimes elements get grouped and layered in unexpected ways.)
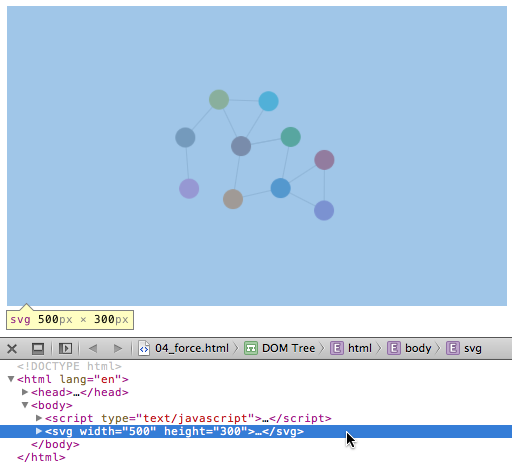
The simplest way is to simply copy the SVG code straight out of the DOM (see Figure 13-3). First, inspect the SVG element. Click the element in the web inspector, and then click Copy.
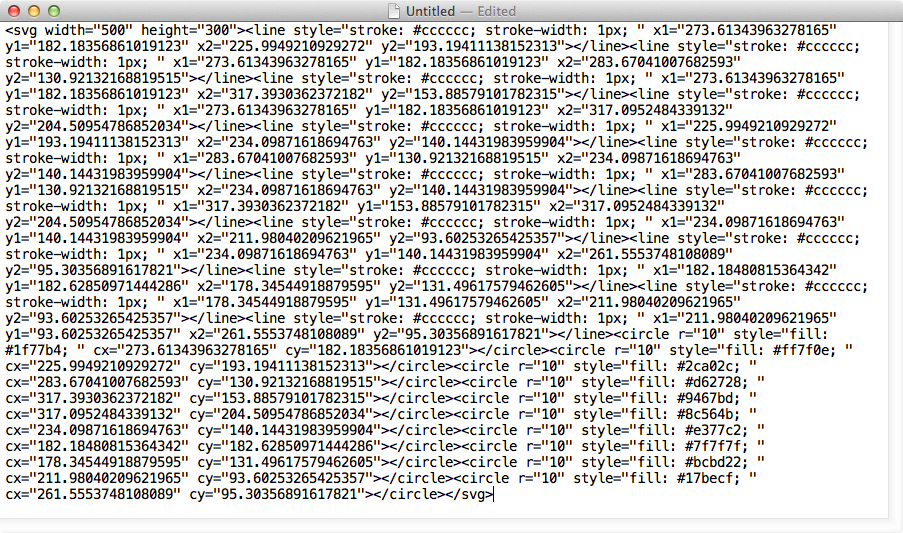
Switch back to your text editor, and paste the contents into a new file, as shown in Figure 13-4.
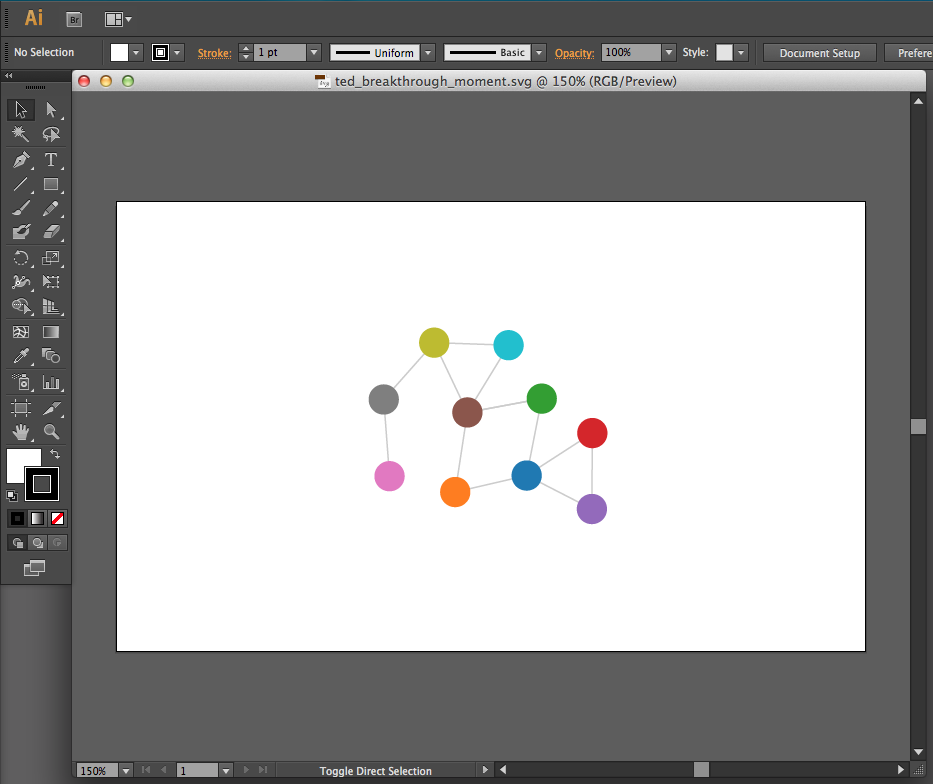
Then just save the file as something.svg. Now you can open it up in Illustrator, as shown in Figure 13-5, or any other SVG-compatible program.
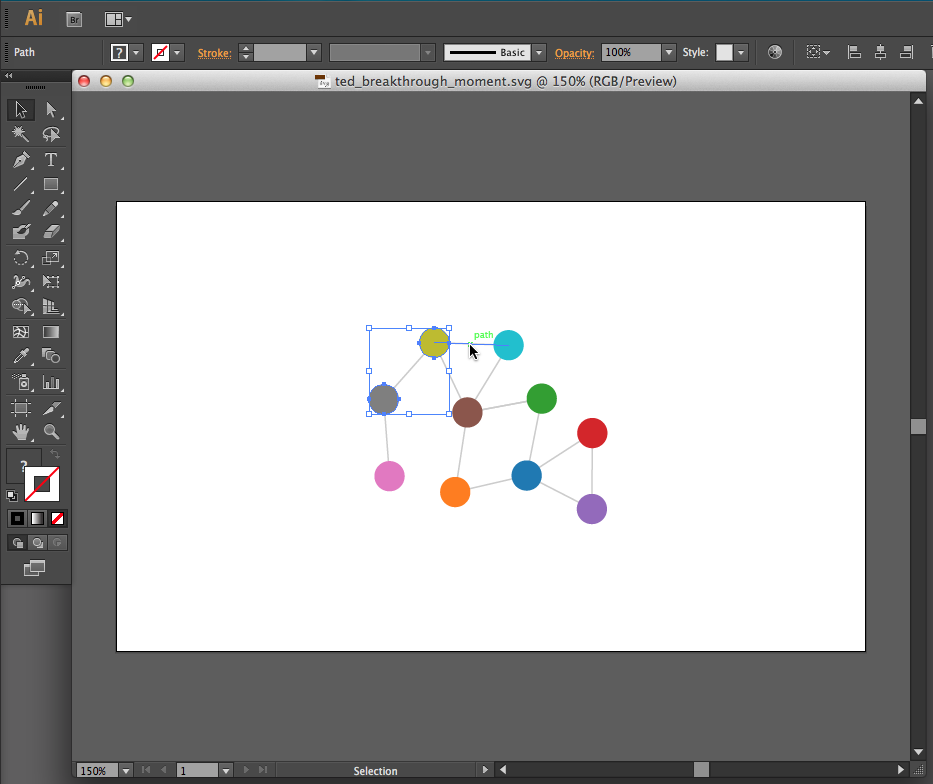
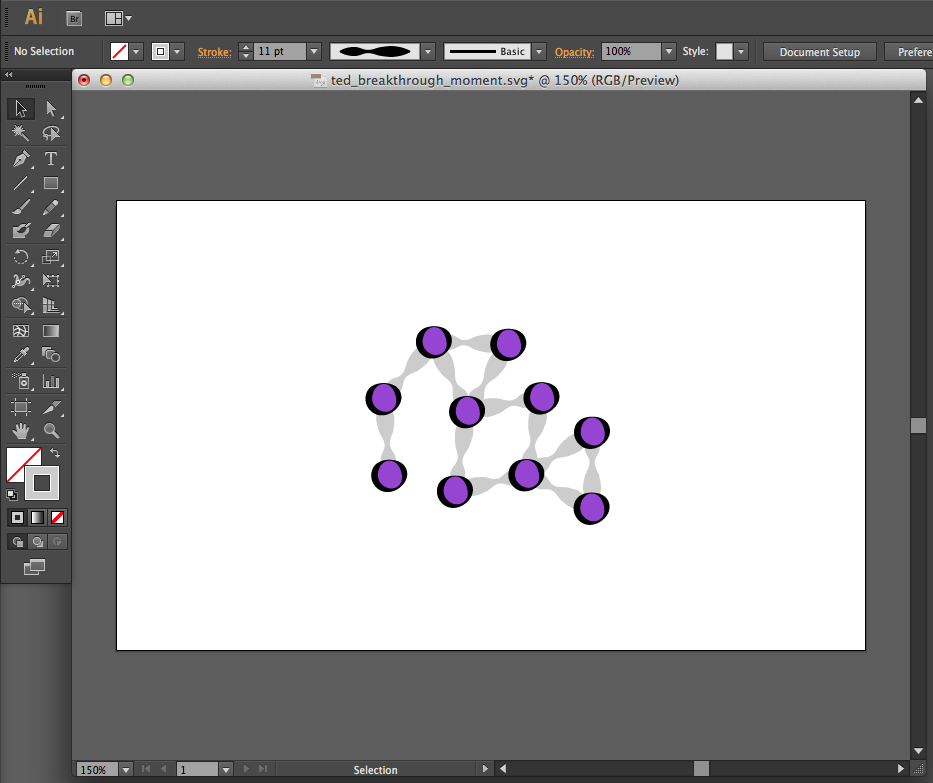
As you can see in Figure 13-6, all of the elements remain individually selectable and editable. In the version shown in Figure 13-7, I’ve made some Tuftean enhancements to my design, adding variable-weight strokes and a neutral, lavender fill for a visually “calming” effect. (To be clear, this is a joke, and neither Tufte nor I endorse this approach.)
As you can see, there are many options for getting your work out of the browser, documented, and saved for use in other contexts, whether for print or for the screen.
Get Interactive Data Visualization for the Web now with the O’Reilly learning platform.
O’Reilly members experience books, live events, courses curated by job role, and more from O’Reilly and nearly 200 top publishers.
