Charts and Graphs
Another form of communication—neither text nor map—can also be created by ArcMap: the chart or graph. The software is capable of producing graphs and charts of both two- and three-dimensional appearance.
____ 46. In ArcMap Click File > New. Select Letter (ANSI A) Portrait. Switch to Data View. Add the personal geodatabase feature class named Soils from
___IGIS-Arc_YourInitials\Wildcat_Boat_Data\ ... you know the drill.
Once the map has appeared in the window, symbolize the SUIT categories using Unique values.
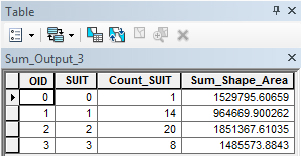
____ 47. Open the Soils attribute table and summarize the suitability (SUIT) column, including the sum from Shape_Area. Accept the default name and save it in Wildcat_Boat.mdb. Agree to add the table to the T/C of the map. Dismiss the Soils attribute table. Open the Sum_Output_x table. It should look about like
Figure 3-15.
____ 48. Select View > Graphs > Create Graph to bring up the Create Graph Wizard. Click the drop-down menu of Graph type, and look at the many types of graphs you can create. Pick Vertical Bar. In the Layer/Table field choose Sum_Output_x (x is some digit, depending on how many tables you have created in this session). For the Value field, you will want Sum_Shape_Area. Make the “X field” SUIT. Uncheck Add to legend. For the Color use Pallet (Excel). Leave the rest of the options at their default values. Click Next. ...