Chapter 4. Handling Time
One crucial difference between programming applications for a stream processor and a batch processor is the need to explicitly handle time. Let us take a very simple application: counting. We have a never-ending stream of events coming in (e.g., tweets, clicks, transactions), and we want to group the events by a key, and periodically (say, every hour) output the count of the distinct events for each key. This is the proverbial application for “big data” that is analogous to the infamous word-counting example for MapReduce.
Counting with Batch and Lambda Architectures
Even if this seems simple, counting is surprisingly difficult at scale and in practice, and, of course, appears everywhere. Other analytics, such as aggregations or operations on Online Analytical Processing (OLAP) cubes, are simple generalizations of counting. Using a traditional batch-processing architecture, we would implement this as shown in Figure 4-1.
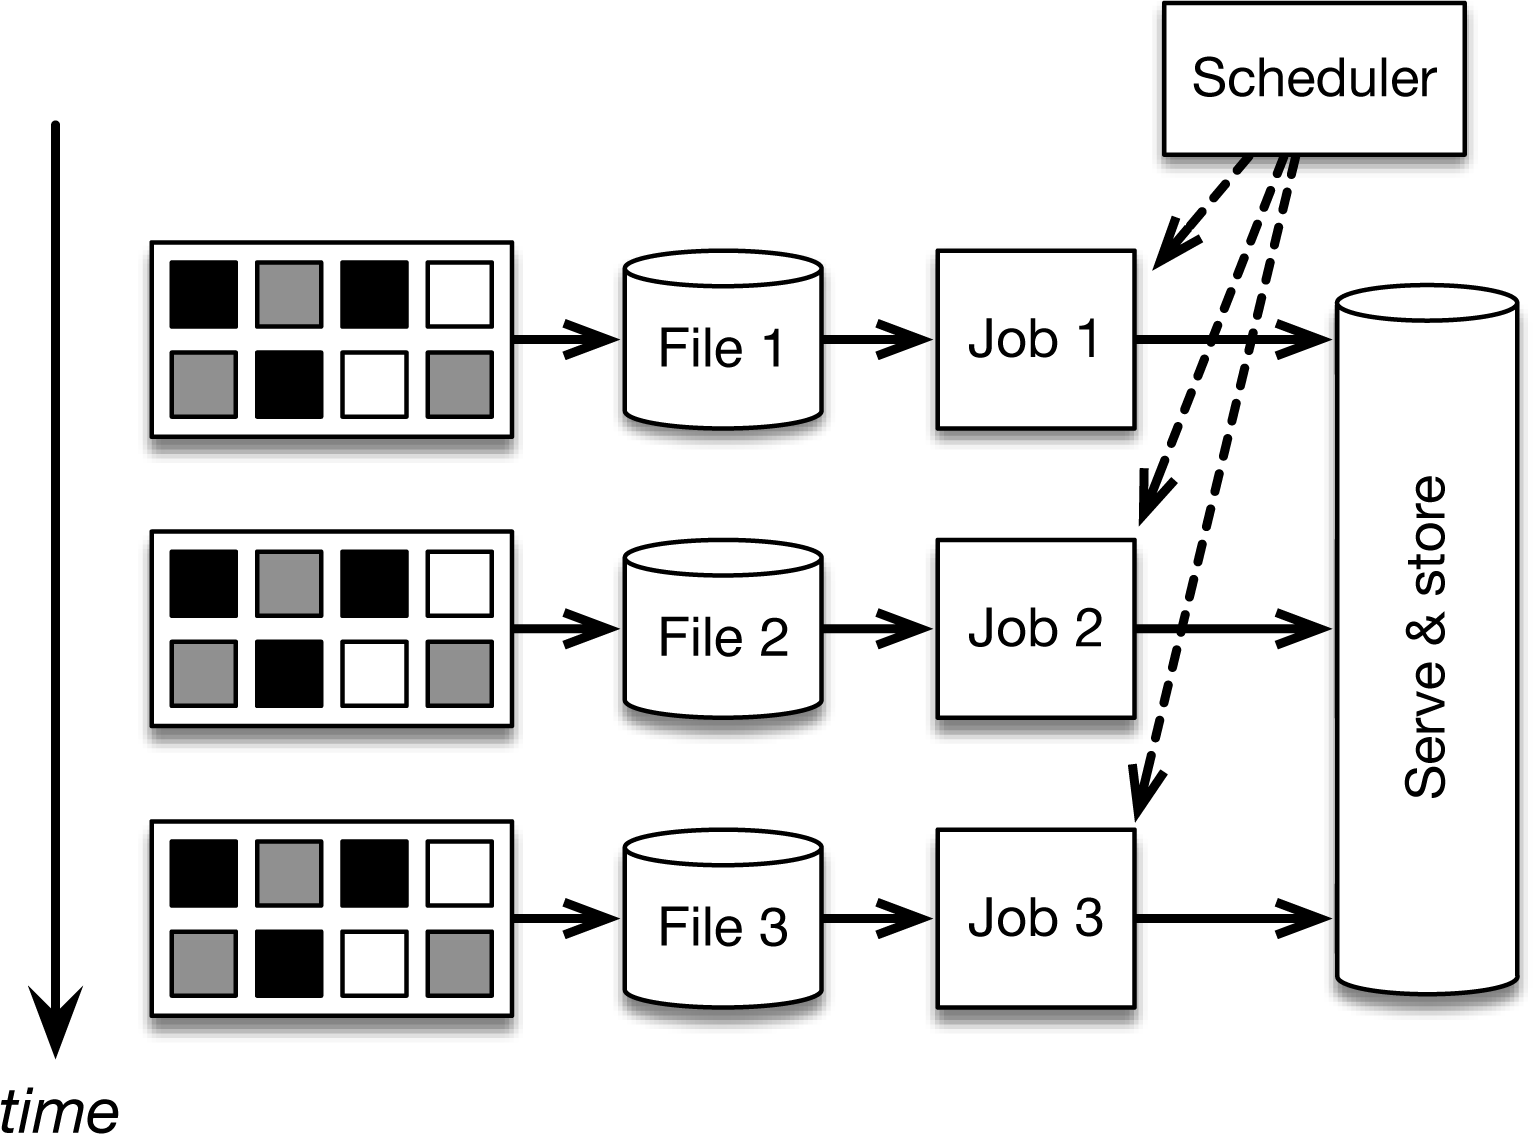
Figure 4-1. Implementing continuous applications using periodic batch jobs. Data is continuously sliced into files, possibly on an hourly basis, and batch jobs are run with these files as input, giving an impression of a continuous processing of incoming data.
In this architecture, a continuous data ingestion pipeline creates files (typically stored in a distributed file store such as Hadoop Distributed File System [HDFS] or MapR-FS) every hour. This can be done by using a tool like Apache Flume. A batch job (using MapReduce or some alternative) is scheduled by a scheduler to analyze the last file produced—grouping the events in the file by key, and counting distinct events per key—to output the last counts. Every company that is using Hadoop has several pipelines like this running in their clusters.
Although this architecture can certainly be made to work, there are several problems with it:
-
Too many moving parts: We are using a lot of systems to count events in our incoming data. All of these come with their learning and administration costs as well as bugs in all of the different programs.
-
Implicit treatment of time: Let’s assume that we want to count every 30 minutes rather than every hour. This logic is part of the workflow scheduling (and not the application code) logic, which mixes DevOps concerns with business requirements.
-
Early alerts: Let’s say that we want to get early count alerts as soon as possible (when receiving, say, at least 10 events), in addition to counting every one hour. For that, we can use Storm to ingest the message stream (Kafka or MapR Streams) in addition to the periodic batch jobs. Storm provides early approximate counts, and the periodic jobs provide the accurate hourly counts. We just added yet another system to the mix, along with a new programming model. This is called the Lambda architecture, described briefly in Chapter 1 and shown here in Figure 4-2.
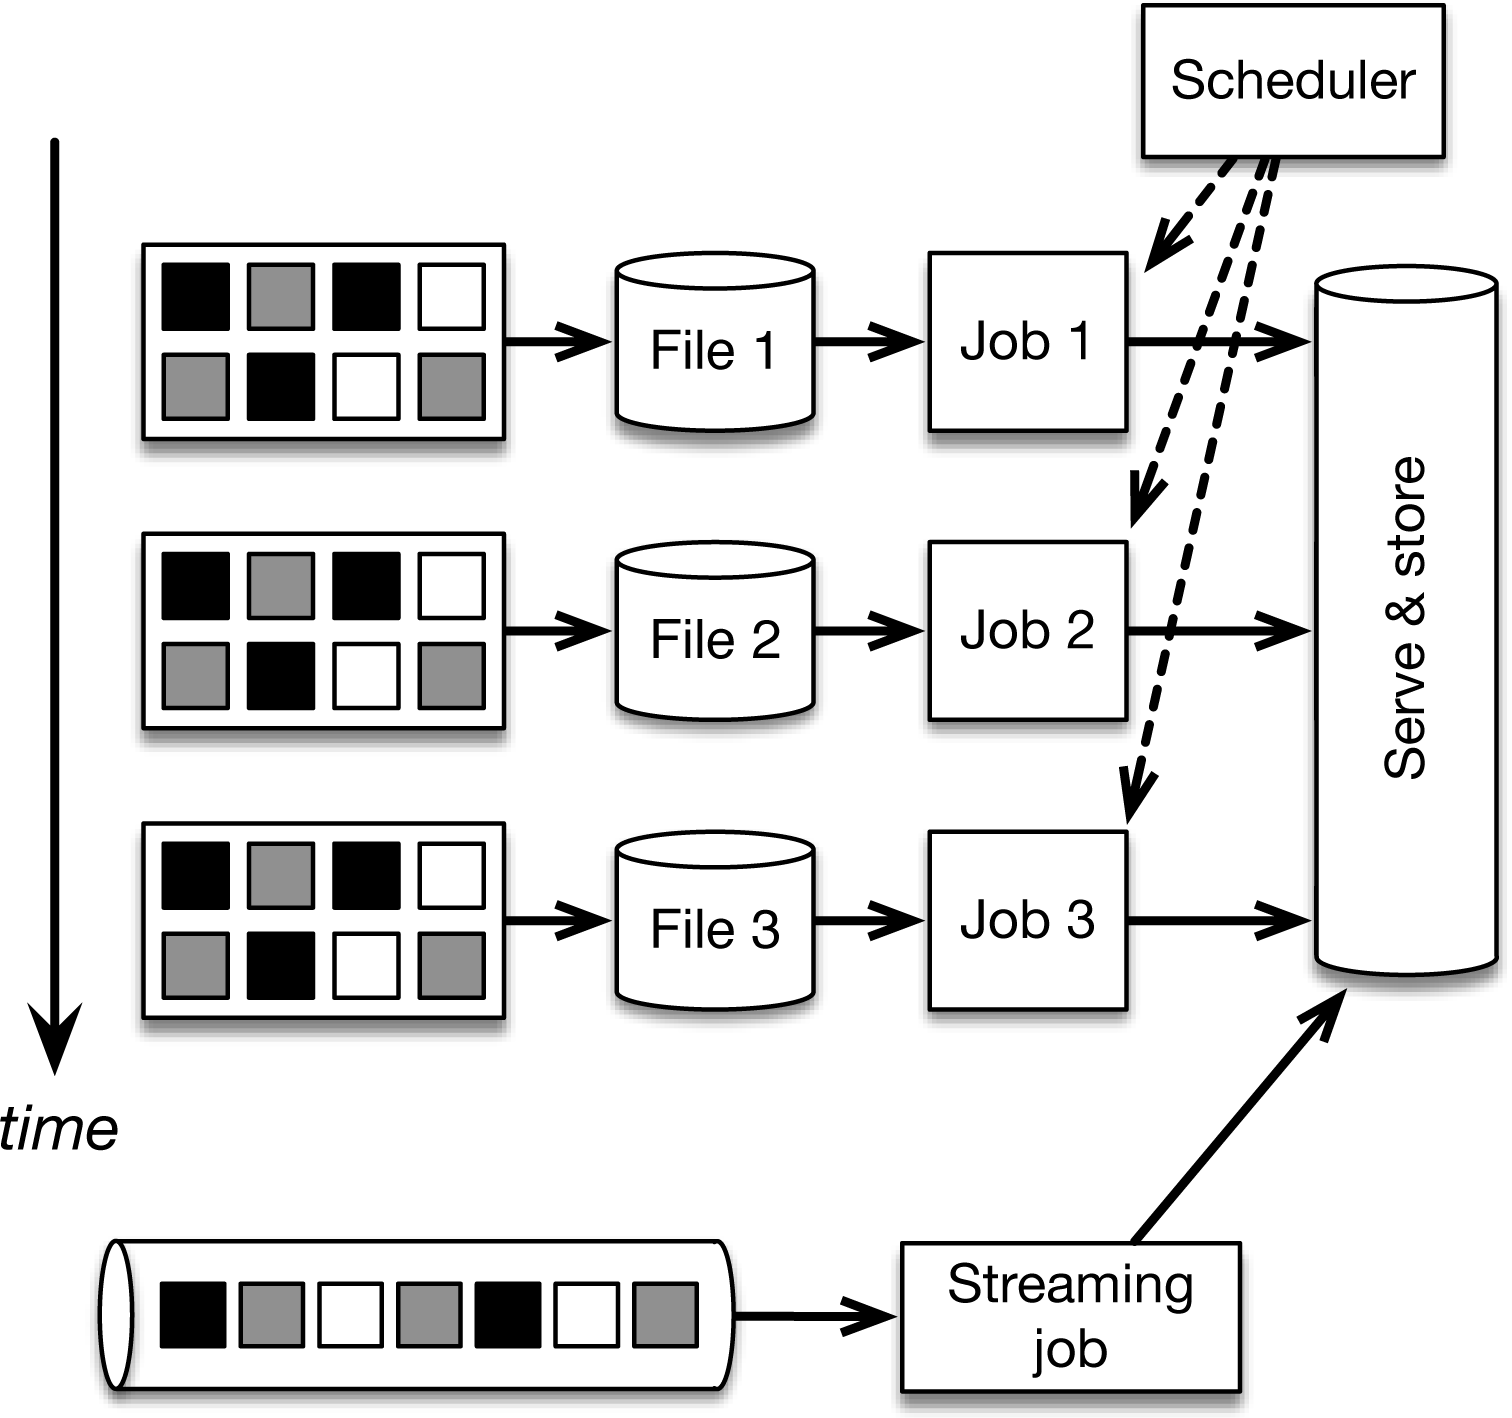
Figure 4-2. Implementing continuous applications using periodic batch jobs and early results using a stream processor (Lambda architecture). The stream processor is used to provide approximate but real-time results, which are eventually corrected by the batch layer.
-
Out of order events: In most real-world streams, events can arrive out of order; that is, the order that the events occur in the real world (as indicated by the timestamps attached to the events when they are produced [e.g., the time measured by the smartphone when a user logs in an application]) is different from the order in which the events are observed in the data center. This means that an event that belongs to the previous hourly batch may be wrongly counted in the current batch. There is really no straightforward way to resolve this using this architecture—most people choose simply to ignore that this reality exists.
-
Unclear batch boundaries: The meaning of “hourly” is kind of ambiguous in this architecture, as it really depends on the interaction between different systems. The hourly batches are, at best, approximate, with events at the edges of batches ending up in either the current or the next batch, with few guarantees. Cutting the data stream into hourly batches is actually the simplest possible way to divide time. Assume that we would like to produce aggregates, not for simple hourly batches, but instead for sessions of activity (e.g., from login until logout or inactivity). There is no straightforward way to do this with the architecture shown in Figure 4-1 and Figure 4-2.
Counting with Streaming Architecture
There surely must be a better way to produce counts from a stream of events. As you might have suspected already, this is a streaming use case in which we use periodic batch jobs to simulate streaming. In addition, we must glue together a variety of systems. Using a streaming architecture, the application would follow the model in Figure 4-3.
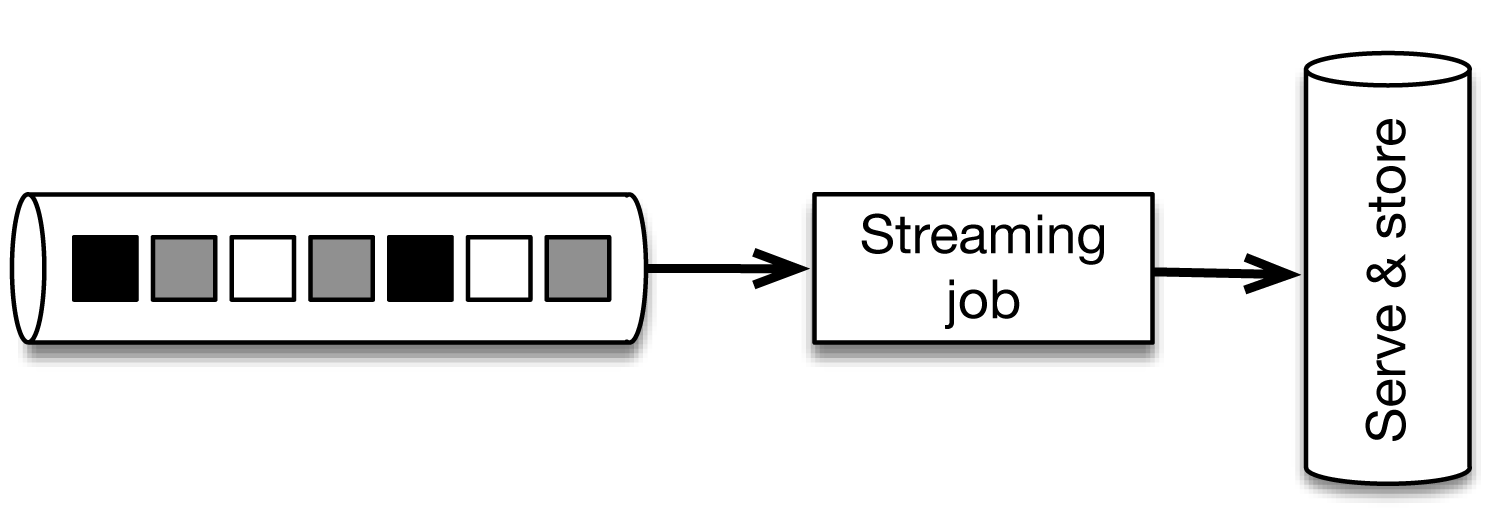
Figure 4-3. Implementing continuous applications using a streaming architecture. The message transport (Kafka, MapR Streams) is shown here as a horizontal cylinder. It supplies streaming data to the stream processor (in our case, Flink) that is used for all data processing, providing both real-time results and correct results.
The event stream is again served by the message transport and simply consumed by a single Flink job that produces hourly counts and (optional) early alerts. This approach solves all the previous problems in a straightforward way. Slowdowns in the Flink job or throughput spikes simply pile up in the message-transport tool. The logic to divide events into timely batches (called windows) is embedded entirely in the application logic of the Flink program. Early alerts are produced by the same program. Out-of-order events are transparently handled by Flink. Grouping by session instead of a fixed time means simply changing the window definition in the Flink program. Additionally, replaying the application with changed code means simply replaying the Kafka topic. By adopting a streaming architecture, we have vastly reduced the number of systems to learn, administer, and create code in. The Flink application code to do this counting is straightforward:
DataStream<LogEvent> stream = env
  // create stream from Kafka
  .addSource(new FlinkKafkaConsumer(...))
  // group by country
  .keyBy("country")
  // window of size 1 hour
  .timeWindow(Time.minutes(60))
  // do operations per window
  .apply(new CountPerWindowFunction());
There are two main differences between the two approaches: 1) we are treating the never-ending stream of incoming events as what it actually is—a stream—rather than trying to artificially cut it into files, and 2) we are explicitly encoding the definition of time (to divide the stream into groups) in the application code (the time window above) instead of implicitly spreading its definition to ingestion, computation, and scheduling.
Batching in Stream Processing Systems
The term “micro-batching,” as we discussed in Chapter 1, has been used to refer to something in between batch and streaming. In reality, micro-batching can mean widely different things depending on the context. In some sense, the batch architecture we saw in Figure 4-1 is a micro-batch architecture if the files are sufficiently small.
Storm Trident implements micro-batching by creating a large Storm event that contains a fixed number of events and processing the aggregated events with a continuously running Storm topology. Spark Streaming implements micro-batching as essentially the batch architecture we saw, but hiding the first two steps (ingestion and storage) from the user and storing the mini-batches internally in memory, in a write-ahead log instead of in files. Finally, every modern stream processor, including Flink, uses a form of micro-batches internally by sending buffers that contain many events over the network in shuffle phases instead of individual events. All of these forms of micro-batching are widely different.
To be clear, batching in stream processing systems should satisfy the following requirements:
-
Batching should be used only as a mechanism to improve performance. The larger the batches, the larger the throughput a system can scale to.
-
Batching for performance should be completely independent of buffering for defining windows, or commits for fault tolerance, and should not be part of the API. Coupling these leads to systems that are limited, hard to use, and fragile.
In the end, as an application developer and user of data processing systems, you should not be concerned about whether a system implements micro-batching and how. Instead, you should worry about whether the system can handle out-of-order streams and sessions and other misaligned windows, whether it can provide early alerts in addition to accurate aggregates, and whether it can deterministically replay past data, as well as the performance characteristics of the system (latency and throughput) and the guarantees of the system in cases of failures.
Notions of Time
In stream processing, we generally speak about two main notions of time:1
-
Event time is the time that an event actually happened in the real world. More accurately, each event is usually associated with a timestamp that is part of the data record itself (e.g., as measured by a mobile phone or a server that emits logs). The event time of an event is simply a timestamp.
-
Processing time is the time that the event is observed by the machine that is processing it. The processing time of an event is simply the time measured by the clock of the machine that is processing the event.
Figure 4-4 illustrates the difference between event time and processing time.
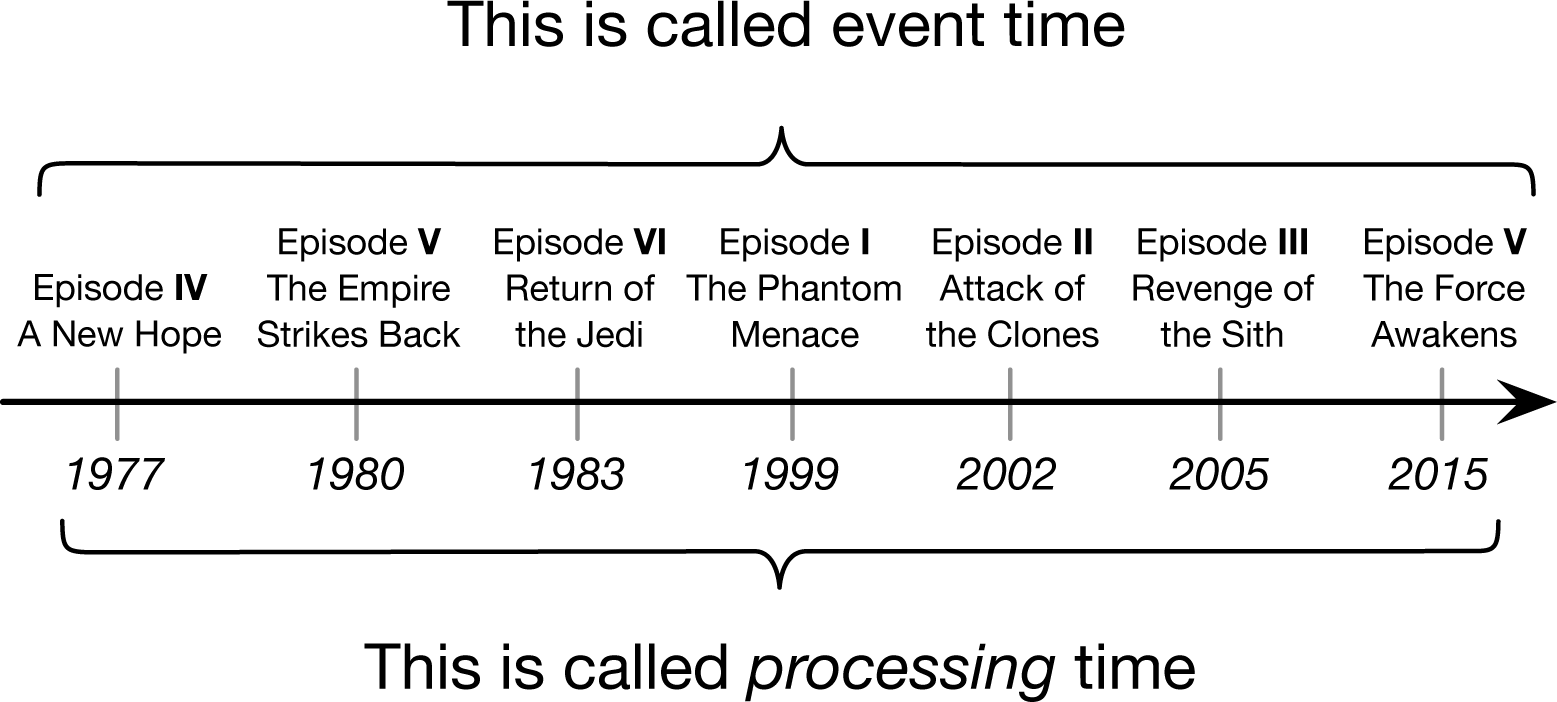
Figure 4-4. An example of an out-of-order stream of events where processing time order is different from event time order.
Consider the Star Wars series of movies: the first movies that appeared in the theaters in 1977, 1980, and 1983 (this is the processing time) were movies 4, 5, and 6 in the plot of the series (which is the event time). Then, the movies that appeared in 1999, 2002, 2005, and 2015 in processing time refer to movies 1, 2, 3, and 7 in event time. Hence, streams can arrive out of order (although typically not years out of order).
Often, a third notion of time called ingestion time or ingress time is used, referring to the time that the event enters the stream processing framework. Data that lacks a true event time may be assigned a time, but these timestamps are simply assigned by the stream processor when it first sees the event (in the source function, the first operator of the program).
Due to various real-world factors (e.g., temporary lack of connectivity, varying delays of the network, clocks in distributed systems, data rate spikes, physics, or just bad luck), event time and processing time always have a time-varying lag (called event time skew). The order of events based on event time is often not the same as the order based on processing time; that is, events arrive at the stream processor out of order.
Both notions of time are useful depending on the application. Some applications (e.g., some alerting applications) need results as fast as possible and are happy if these results are slightly inaccurate. In such cases, it is not necessary to wait for late events, and processing time semantics is a great choice. Other applications (e.g., fraud detection or billing) need accuracy: an event should be accounted for in the time window that it actually happened. For these applications, event time semantics is usually the right choice. And there are also applications that need both, perhaps to produce accurate counts, but also to provide an early alert if an anomaly is detected.
Tip
Flink allows the user to define windows in processing time, ingestion time, or event time, depending on the desired semantics and accuracy needs of the application.
When a window is defined in event time, the application can handle out-of-order events and varying event-time skew. It will compute meaningful results with respect to the time inherent to the events.
Windows
In the first section of this chapter, we reviewed an example of defining a time window in Flink, to aggregate the results of the last hour. Windows are the mechanism to group and collect a bunch of events by time or some other characteristic in order to do some analysis on these events as a whole (e.g., to sum them up).
Time Windows
The simplest and most useful form of windows are those based on time. Time windows can be tumbling or sliding. For example, assume that we are counting the values emitted by a sensor and compare these choices:
A tumbling window of 1 minute collects the values of the last minute, and emits their sum at the end of the minute, as shown in Figure 4-5.

Figure 4-5. A tumbling time window of 1 minute that sums the last minute’s worth of values.
A sliding window of 1 minute that slides every half minute counts the values of the last minute, emitting the count every half minute, as shown in Figure 4-6.
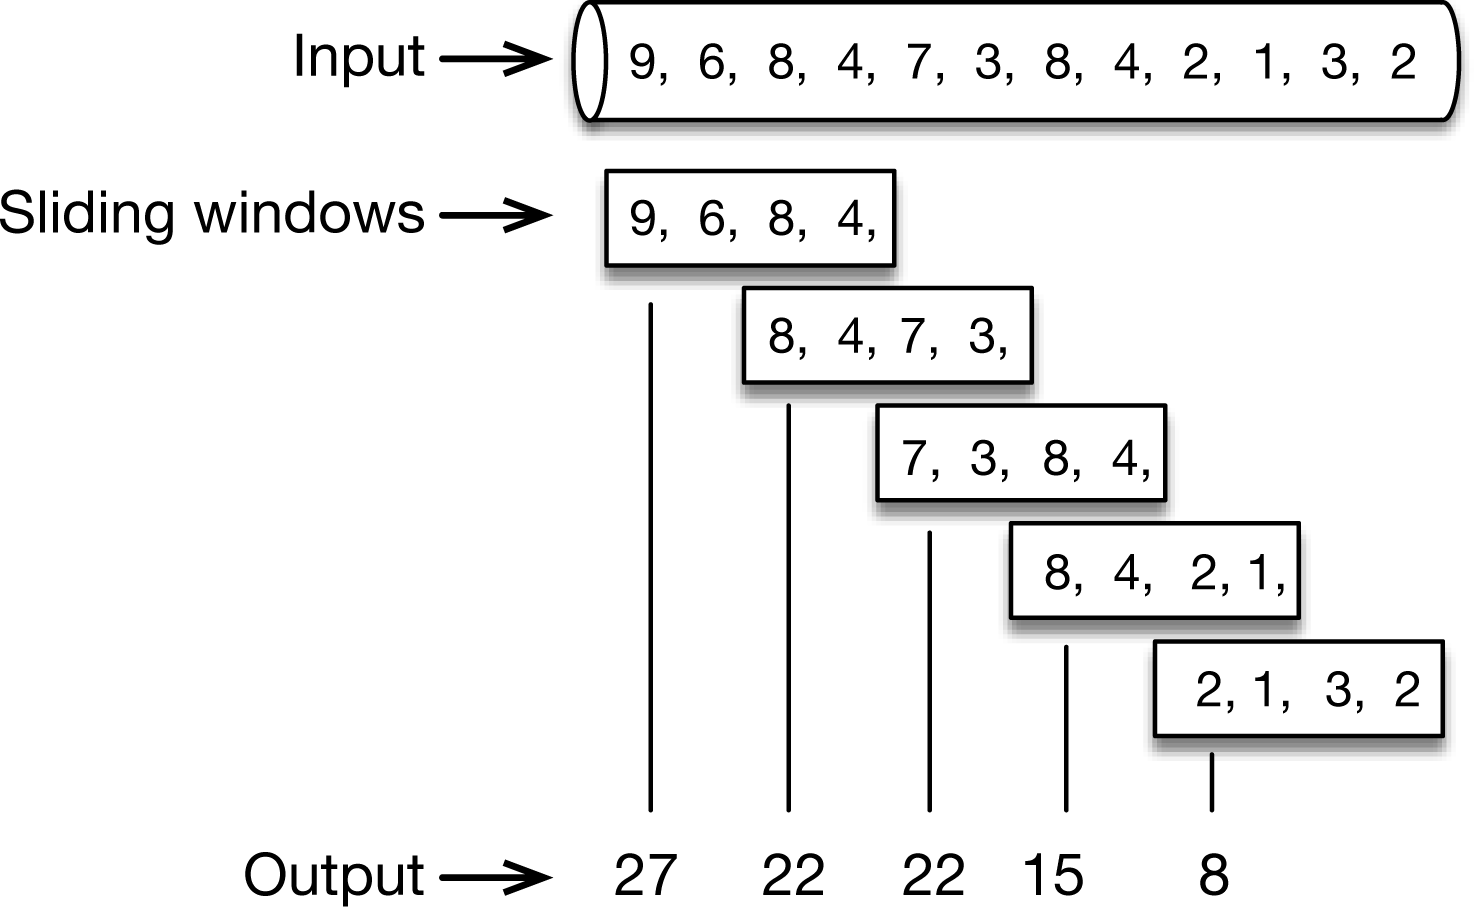
Figure 4-6. A sliding time window that computes the sum of the last minute’s values every half minute.
In the first sliding window, the values 9, 6, 8, and 4 are summed up, yielding the result 27. Next, the window slides by a half minute (say, 2 values in our example), and the values 8, 4, 7, 3 are summed up, yielding the result 22, etc. A tumbling time window of 1 minute can be defined in Flink simply as:
stream.timeWindow(Time.minutes(1))
And a sliding time window of 1 minute that slides every 30 seconds can be defined as simply as:
stream.timeWindow(Time.minutes(1), Time.seconds(30))
Count Windows
Another common type of window supported by Flink is the count window. Here, we are grouping elements based on their counts instead of timestamps. For example, the sliding window in Figure 4-6 can also be interpreted as a count window of size 4 elements that slides every 2 elements. Tumbling and sliding count windows can be defined as simply as:
stream.countWindow(4)
stream.countWindow(4, 2)
Count windows, while useful, are less rigorously defined than time windows and should be used with care. Because time always goes on, a time window will always eventually “close.” However, with a count window of, say, 100 elements, you might have a situation where there are never 100 elements for this key, which will lead to the window never closing, and the memory occupied by the window will remain garbage. One way to mitigate that is to couple a time window with a timeout using a trigger, which we will describe later in the section “Triggers”.
Session Windows
Another very useful type of window provided by Flink is the session window. As mentioned briefly in Chapter 3, a session is a period of activity that is preceded and followed by a period of inactivity; for example, a series of interactions of a user on a website, followed by the user closing the browser tab or simply becoming inactive. Sessions need their own mechanism because they typically do not have a set duration (some sessions can be 30 seconds and another 1 hour), or a set number of interactions (some sessions can be 3 clicks followed by a purchase and another can be 40 clicks without a purchase).
Note
Flink is currently the only open source stream processing engine that supports sessions.
Session windows in Flink are specified using a timeout. This basically specifies how long we want to wait until we believe that a session has ended. For example, here we expire a session when the user is inactive for five minutes:
stream.window(SessionWindows.withGap(Time.minutes(5))
Triggers
In addition to windows, Flink also provides an optional mechanism to define triggers. Triggers control when the results are made available—in other words, when the contents of a window will be aggregated and returned to the user. Every default window comes coupled with a trigger. For example, a time window on event time is triggered when a watermark arrives. But as a user, you can also implement a custom trigger (for example, providing approximate early results of the window every 1 second) in addition to the complete and accurate results when the watermark arrives.
Implementation of Windows
Internally in Flink, all of these types of windows are implemented using the same mechanism. Although the internals of the mechanism are not important for basic users, it is important to note that:
-
The windowing mechanism is completely separate from the checkpointing mechanism (discussed in detail in Chapter 5). This means that the window duration has no dependency on the checkpointing interval, and, indeed, one can define windows without a “duration” (e.g., the count and session windows we saw above).
-
Advanced users can directly use the underlying mechanism to define more elaborate forms of windows (e.g., time windows that also produce an intermediate result based on count, or even a value of a specific record).
Time Travel
An aspect central to the streaming architecture is time travel. If all data processing is done by the stream processor, then how do we evolve applications, how do we process historical data, and how do we reprocess the data (say, for debugging or auditing purposes)? This idea is presented in Figure 4-7.
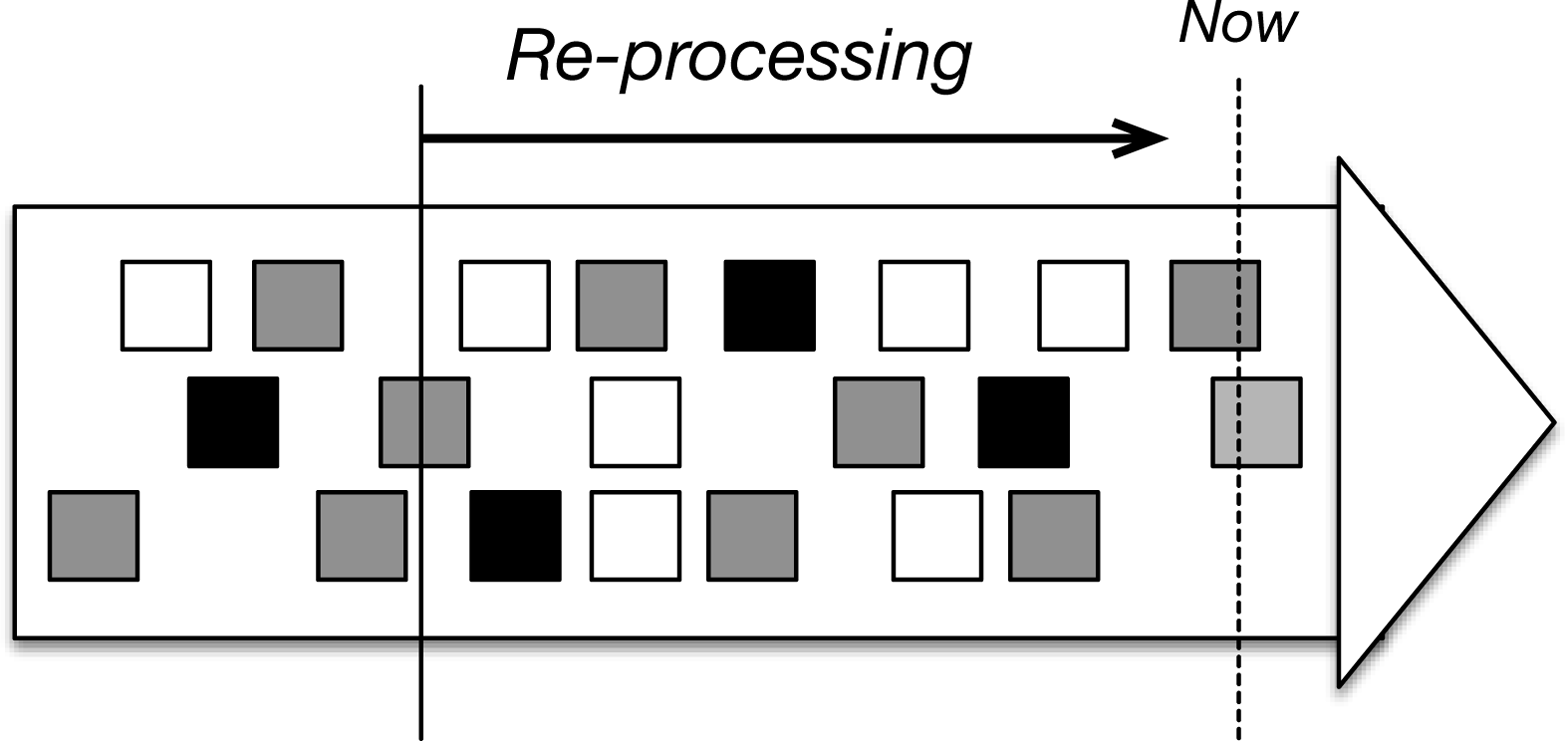
Figure 4-7. Time travel for data reprocessing. Support for event time by the stream processor means that rerunning the same program on the same data by rewinding the stream will yield the same results.
As shown in Figure 4-7, time travel means rewinding the stream to some time in the past and restarting the processing from there, eventually catching up with the present. Modern transport layers like Apache Kafka and MapR Streams support this functionality, setting them apart from older solutions. Whereas real-time stream processing always processes the last data (the “now”) in the figure, historical stream processing starts from the past and (optionally) catches up with the present.
Note
To be able to travel back in time and reprocess the data correctly, the stream processor needs to support event time.
If windows are defined based on wall-clock time instead of the timestamps embedded in the records themselves, every time we run the same application, we will get a different result. Event time makes processing deterministic by guaranteeing that running the same application on the same stream will yield the same results.
Watermarks
We saw that support for event time is central to the streaming architecture, providing accuracy and the ability to reprocess data. When computation is based on event time, how do we know that all events have arrived, and that we can compute and output the result of a window? In other words, how do we keep track of event time and know that a certain event time has been reached in the input stream? To keep track of event time, we need some sort of clock that is driven by the data instead of the wall clocks of the machines performing the computation.
Consider the 1-minute tumbling windows of Figure 4-5. Assume that the first window starts at 10:00:00 (meaning 10 hours, 0 minutes, 0 seconds) and needs to sum up all values from 10:00:00 until 10:01:00. How do we know that the time is 10:01:00 when time is part of the records themselves? In other words, how do we know that an element with timestamp 10:00:59 will not arrive?
Flink achieves this via watermarks, a mechanism to advance event time. Watermarks are regular records embedded in the stream that, based on event time, inform computations that a certain time has been reached. When the aforementioned window receives a watermark with a time marker greater than 10:01:00 (for example, both a watermark with time marker 10:01:00 and a watermark with time marker 10:03:43 would work the same), it knows that no further records with a timestamp greater than the marker will occur; all events with time less than or equal to the timestamp have already occurred. It can then safely compute and emit the result of the window (the sum). With watermarks, event time progresses completely independently from processing time. For example, if a watermark is late (“late” being measured in processing time), this will not affect the correctness of the results, only the speed in which we get the results.
How Watermarks Are Generated
In Flink, the application developer generates watermarks, as doing so usually requires some knowledge of the domain. A perfect watermark is a watermark that can never be wrong; that is, no event will ever arrive after a watermark with an event time from before the watermark. Under special circumstances, the timestamp from the latest event might even be a perfect watermark. This could happen, for example, if our input is perfectly ordered. A heuristic watermark, in contrast, is just an estimate of the time progress, but can sometimes be wrong, meaning that some late events can come after the watermark that promised they would not come. Flink provides mechanisms to deal with late elements when watermarks are heuristic.
Domain knowledge is often used to specify a watermark. For example, we may know that our events might be late, but cannot possibly be more than five seconds late, which means that we can emit a watermark of the largest timestamp seen, minus five seconds. Or, a different Flink job may monitor the stream and construct a model for generating watermarks, learning from the lateness of the events as they arrive.
Note
Watermarks provide a (possibly heuristic) mechanism to specify the completeness of our input in event time.
If watermarks are too slow, we might see a slowdown in the speed with which we are getting output, but we can remedy that by emitting approximate results even before the watermark (Flink provides mechanisms for doing so). If watermarks are too fast, we might get a result that we think is correct but is not, and we can remedy that by using Flink’s mechanisms for late data. If all of this seems complicated, remember that most event streams in the real world are out of order and that there is no such thing (usually) as perfect knowledge about how out of order they are. (In theory, we would have to look at the future for that.) Watermarks are the only mechanism that require us to deal with out-of-order data and to bound the correctness of our results; the alternative would be ignoring reality and pretending that our results are correct when they are not, without any bounds on their correctness.
A Real-World Example: Kappa Architecture at Ericsson
Motivated by the scale of data that a typical Ericsson-powered operator needs to process (10 to 100 terabytes per day, or 100,000 to 1,000,000 events per second), a team at Ericsson sought to implement a so-called “Kappa architecture.”2 This term was coined (somewhat tongue-in-cheek) by Jay Kreps, one of the creators of Apache Kafka in an O’Reilly Radar article in 2014, as a critique to the so-called Lambda architecture. This is just another name for exactly the streaming architecture that we discussed in Chapter 2: the data stream is at the heart of the design; data sources are immutable; and a single-stream analytics framework, such as Apache Flink, is used to process both the fresh data as well as the historical data via stream replay.
The use case is real-time analysis of logs and system performance metrics of a live cloud infrastructure, to continuously monitor whether the cloud is behaving normally or showing a “novelty.” A novelty can be either an anomalous behavior, or a change of the state in the system; for example, the addition of new virtual machines. The approach they took was to apply a Bayesian online learning model to a stream of various metrics (telemetry and log events) of a telco cloud monitoring system. In the words of Ericsson researchers Nicolas Seyvet and Ignacio Mulas Viela:
The proposed method quickly detects anomalies with high accuracy while adapting (learning) over time to new system normals, making it a desirable tool for considerably reducing maintenance costs associated with operability of large computing infrastructures.
The data pipeline that the Ericsson team built is shown in Figure 4-8.
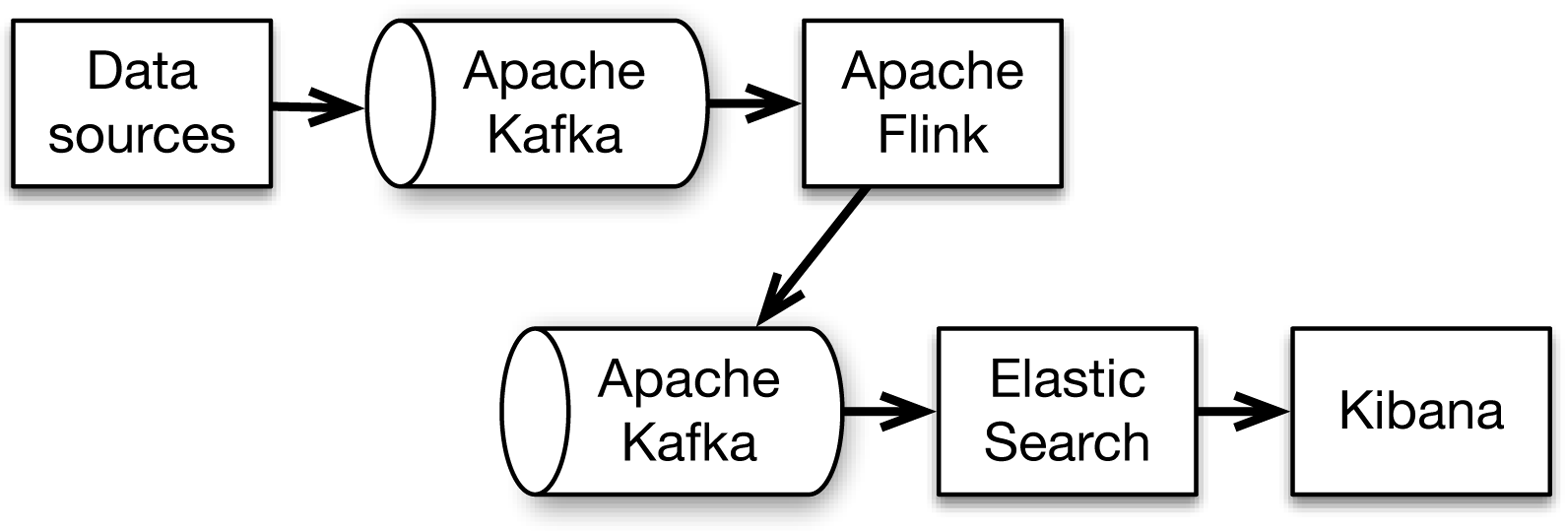
Figure 4-8. Streaming architecture using Apache Flink at Ericsson.
The raw data pushed to Kafka is telemetry and log events from all physical and virtual machines in the cloud. Then, different Flink jobs consume this data and write them back to Kafka topics, from which they are pushed to Elastic Search and Kibana, a search index and visualization system, respectively. This architecture allows each Flink job to perform a well-defined task, as the output of one job can be used as input of another. For example, the pipeline to detect anomalies in the equipment is shown in Figure 4-9, where every intermediate stream is a Kafka topic (named for the data assigned to it), and every rectangle is a Flink job.
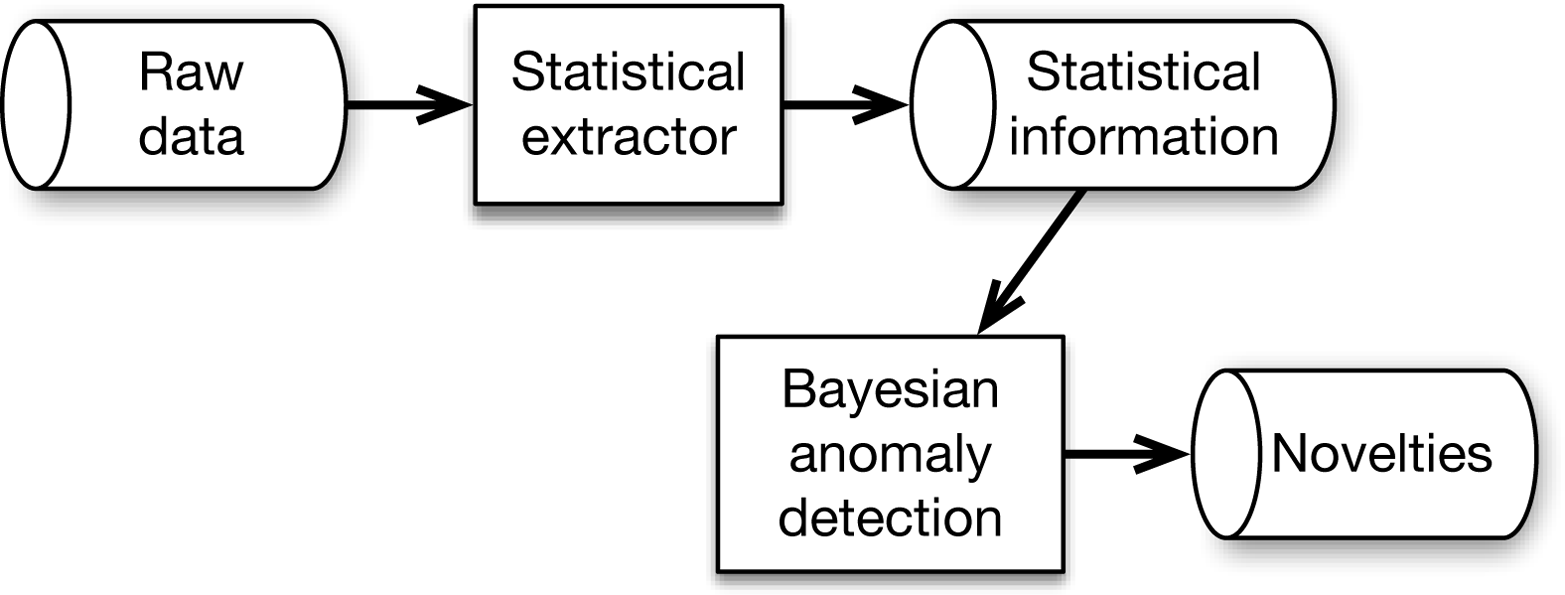
Figure 4-9. The data processing pipeline at Ericsson for anomaly detection uses Flink for the statistical extractor application and for anomaly detection.
So, why is Flink’s support for event time important for this application? There are two reasons:
-
Correctly classifying anomalies: Timing is crucial for deciding upon an anomaly. For example, lots of logging events being generated at the same time is often a predictor of something being wrong. In order to group and classify those events correctly, it is important to take into account the time at which these events were actually generated (rather than the time we see them in the processing pipeline).
-
Using stream-first architecture: In the streaming architecture, the stream processor is used for all computations. The way to evolve applications is to repeat their execution in the stream processor; running the same data twice through a computation must produce the same result, and this is only possible when operating on event time.
1 Many of the ideas in this chapter were pioneered by the work of the Google Dataflow team (now Apache Beam [incubating]), including Tyler Akidau, Frances Perry, and others. Tyler Akidau’s articles Streaming 101 and Streaming 102 are excellent reads if you’d like to dig further into the Dataflow model. Flink’s mechanisms for handling time and windows are in large part rooted in the broad concepts of the Dataflow paper in VLDB 2015.
2 This section is based on the work by Nicolas Seyvet and Ignacio Mulas Viela, presented at Flink Forward 2015 and at Strata/Hadoop World London 2016.
Get Introduction to Apache Flink now with the O’Reilly learning platform.
O’Reilly members experience books, live events, courses curated by job role, and more from O’Reilly and nearly 200 top publishers.

