Chapter 10. Debugging and Error Handling
10.0. Introduction
It would be wonderful if we could, by some miracle, manage to create JavaScript applications that never fail, never have errors, never go wrong. Then we would have perfection and wouldn’t need things like debuggers and error handling. But what would be the fun in that?
There are two types of errors in JavaScript. The first is a programming error, where we, the JavaScript developers, do something wrong. These types of errors are typically found using our favorite browser and our favorite debugger.
At a minimum, what we need from a debugger is the ability to stop program execution and then examine variables and objects at that point. It also helps if we can continue the program by steps, drill into functions, and examine network activity and the state of the DOM at any time. However, we can usually manage debugging if we have the ability to stop a program and examine object values.
The second type of error occurs when the web page reader answers a question incorrectly, pushes the wrong button, or tries to type in a Social Security number when we’re expecting a name. Or the error can happen when we’re mixing libraries and something goes wrong between them. We’ll look at these kinds of errors first, and then we’ll get into the various browsers and their debugging capabilities.
10.1. Gracefully Handling No JavaScript Support
Problem
You want to ensure your pages work as well with JavaScript turned off as when it’s turned on.
Solution
One approach is to the use the noscript element to
provide alternative functionality:
<script type="text/javascript">
document.writeln("<p>Some content</p>");
</script>
<noscript><p>Fall back account</p></noscript>
However, more modern applications make an assumption that JavaScript is turned off, and ensure the page works correctly script-free. Once that’s taken care of, we add script to make the page more interactive.
Discussion
Several years ago, it wasn’t uncommon to find script blocks
scattered about a page, generating web page content on the fly. To
ensure that something showed up even if scripting was turned off, the
developers would match the script with a noscript element. This noscript element would provide fallback page
content or information. The noscript
element has gone out of favor, and is listed as obsolete in HTML5. Now,
web developers create the entire page and all of its content without any
scripting enabled. Then, and only then, they’ll add script to make the
page more helpful, interactive, or even fun.
For example, a web page can have several form elements. It’s workable, but having many
form elements can take up a lot of
space. However, the form elements
have to be available if scripting is turned off.
To solve the problem, the developer can style the form elements to
be displayed by default, and then use JavaScript to turn off the display
of some of the elements when the page loads. Based on the web page
reader’s actions, form elements will
be displayed and hidden as needed. This ensures that the form elements are always available and only
hidden when support for scripting is ensured.
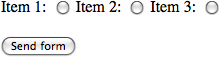
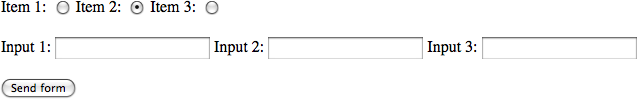
Example 10-1 shows a
very simple implementation of this type of functionality. If scripting
is turned off, all of the form
elements display by default. If scripting is turned on, however, the
text input elements in the lower part of the form are hidden when the
page is loaded (note emphasized code), and only displayed when the
second radio button is clicked.
<!DOCTYPE html>
<html xmlns="http://www.w3.org/1999/xhtml">
<head>
<title>Hide/Show</title>
<style>
</style>
<script>
//<![CDATA[

var inprocess=false;

window.onload=function() {

  document.getElementById("hidden_elements").style.display="none";

  //  attach the click event handler to the radio buttons
  var radios = document.forms[0].elements["group1"];
  for (var i = [0]; i < radios.length; i++)
    radios[i].onclick=radioClicked;
}

function radioClicked() {
   if (this.value == "two") {
    document.getElementById("hidden_elements").style.display="block";
   } else {
    document.getElementById("hidden_elements").style.display="none";
   }
}

//--><!]]>
</script>
</head>
<body>
<form id="picker" method="post" action="">
Item 1: <input type="radio" name="group1" value="one" />
Item 2: <input type="radio" name="group1" value="two" />
Item 3: <input type="radio" name="group1" value="three" /><br />
<br />
<div id="hidden_elements">
Input 1: <input type="text" id="intext" />
Input 2: <input type="text" id="intext2"  />
Input 3: <input type="text" id="intext3"  /><br /><br />
</div>
<input type="submit" id="submitbutton" value="Send form" />
</form>
</body>
</html>
Figure 10-1 shows what the page looks like if scripting is disabled, and Figure 10-2 shows what the page looks like with scripting enabled.
Note
This concept of adding scripting after the page is fully constructed is known as progressive enhancement. It was the brain child of Steven Champeon of http://hesketh.com.
See Also
There are several good articles on progressive enhancement. You can start with:
To ensure the accessibility of this effect, check out the use of ARIA in Chapter 14.
10.2. Checking for Errors in Functions
Solution
The simplest approach to signaling an error in a function is through the returned result:
function sumNumbers(numArray) {
  var result = 0;

  // sum numbers in array
  // unless array is empty, or nonnumber reached
  if (numArray.length > 0) {
    for (var i = 0; i < numArray.length; i++) {
      if (typeof numArray[i] == "number") {
        result+=numArray[i];
      }
      else {
        result = NaN;
        break;
      }
    }
  }
  else {
     result = NaN;
  }
  return result;
}
...
  var ary = new Array(1,15,"three",5,5);
  var res = sumNumbers(ary); // res is NaN
  if (isNaN(res)) alert("Encountered a bad array or array element");
Discussion
A simple way to return an error from a function is through the result. The important point to remember is that the return value and type need to match what you would expect from the data type of the result if things had gone well.
In the solution, the global NaN value is returned
if the array was empty, or has at least one entry that isn’t a number.
The result is tested with the isNaN
function, and if the result is NaN, a
message to that effect is given.
10.3. Using an Alert for Simple Debugging
Discussion
Most developers use what I call the poor man’s debugging tool:
printing out the value of a variable using whatever output functionality
is available. With JavaScript, the poor man’s debugging usually occurs
through an alert message box or with
the JavaScript console, if the console is supported by the
browser.
To use an alert message box to debug, just provide the variable in the function call:
alert(variableName);
If the variable is a simple scalar value, the result of this function call is a printout of the string value of the object’s contents. If the object is more complex, the print results will vary. For instance, an array will have a print out value like the following:
var fruit = ['apple','cherry','pear'];
alert(fruit); // prints out apple, cherry, pear
The array values are all printed out, in order, with a comma between the entries.
Using an object with the alert can have interesting effects. If
you pass a variable containing a reference to a web page element, you
may get unpredictable results depending on the browser used, its age,
the DOM the browser supports, and so on. For the most part, though, and
for most web page elements, the object printouts will be the same. In
Safari 4, a variable with a reference to a div element:
alert(divElement);
prints out as:
[object HTMLDivElement]
Not particularly useful. However, the following could provide useful information:
alert(divElement.innerHTML); // prints out contents of div element
Anything beyond these simple printouts, though, should be left for browser debuggers.
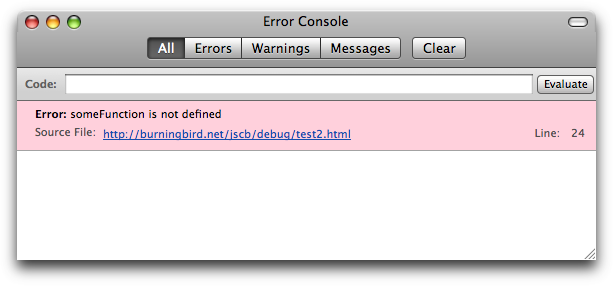
10.4. Catching an Error and Providing Graceful Error Handling
Solution
Use the try...catch exception
handling technique:
try {
  someFunction(var1);
} catch (e) {
  alert (e.message);
}
finally {
  j = null;
}
Discussion
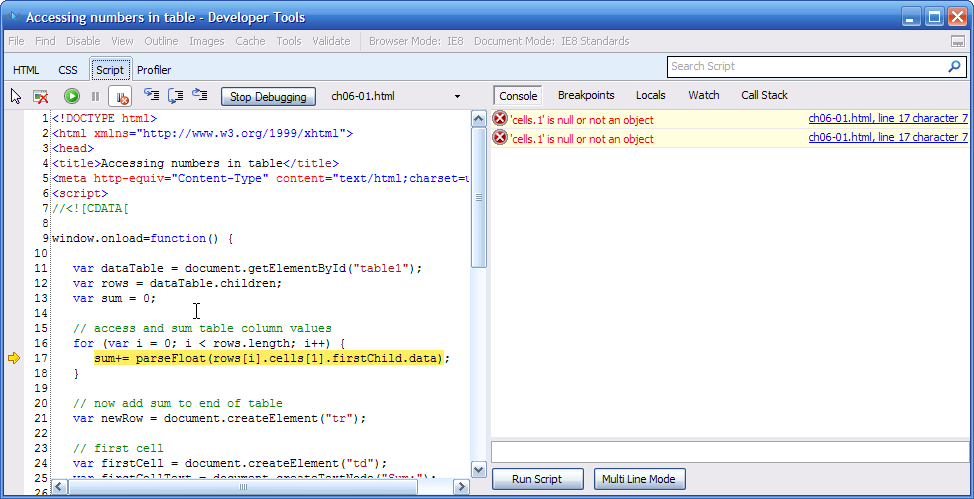
In the solution, the code accesses a function that hasn’t been defined. Normally, this would trigger a JavaScript error, resulting in an error message like that shown in the Firefox JavaScript console in Figure 10-3. It would also cause the script to fail at that point. It’s an effective error-handling mechanism, but not a particularly graceful or helpful one.
When the code that could result in an error is contained in a
try statement, the
associated catch statement handles
the exception it causes. After the error is processed, the program
control then skips to the first statement that follows the exception
handling statements.
You can also use an optional finally statement with
code that you want to process regardless of the success of the try statement. You’ll most likely want to use
the finally statement to do any
necessary cleanup.
The exception in the solution is an Error object, and it comes with useful information. In the
solution, the error message is accessed and printed out to an alert
message box. Peering into the exception in Firefox, we find the
following properties:
The fileName, lineNumber, and stack are nonstandard Firefox extensions and
aren’t guaranteed to exist between browsers. The message and error name are standard, and should always be
available if the application or browser implements JavaScript exception
handling.
10.5. Initiating Manageable Errors
Problem
You want to incorporate custom exceptions into your applications or libraries that provide useful information to calling applications.
Solution
Use the throw statement, and
create a custom object as an exception:
if (typeof value == "number") {
    sum+=number;
} else {
   throw "NotANumber";
}
Discussion
The throw statement is partner
to try...catch. With throw, you can throw exceptions rather than
returning error values from functions or setting some global error
value. The advantage to using throw
and try...catch is that it doesn’t
matter how deeply nested the error occurs, as the exception can ensure
that the error is reflected to the calling application, and cleanly,
too.
In the solution, the exception is thrown as a string. You can also
throw an integer, Boolean, or object. If you only need to provide an
exception message, use the string—or an integer if you’re using an array
of exceptions, and the integer is used to look up the error. Otherwise,
either create and throw a specific exception, or create a new Error object, providing your own error
message:
if (typeof value == "number") {
    sum+=number;
} else {
   throw new Error("NotANumber");
}
The existing exception types are Error, as demonstrated, and:
EvalErrorRangeErrorReferenceErrorSyntaxErrorTypeErrorURIErrorDOMExceptionEventExceptionRangeException
The last three exceptions are related to the DOM API. All the
errors take a custom message as a string parameter.
10.6. Using Firebug with Firefox
Solution
Use Firebug, the popular Firefox add-on development tool.
Discussion
Unlike other development tools, Firebug is a Firefox add-on, which you’ll need to download and install. However, it installs very easily, and new releases update through Firefox automatically.
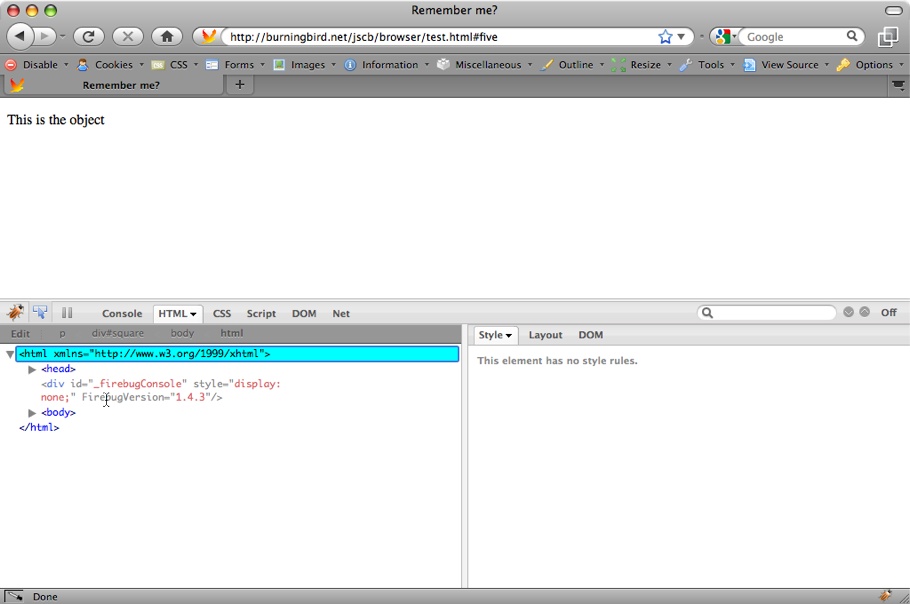
To start Firebug, look for the little bug in the status bar, on the right of the browser. Clicking the bug opens Firebug, as shown in Figure 10-4.
The Firebug tab pages include the Console, the HTML element inspector, the CSS panel, the Script tab, the DOM tree tab, and the Net tab. The Net tab will be handy later in the book when we’re working with Ajax, but for now, we’ll take a look at the HTML, DOM, and CSS tabs before going into more detail on the Script debugger and Console.
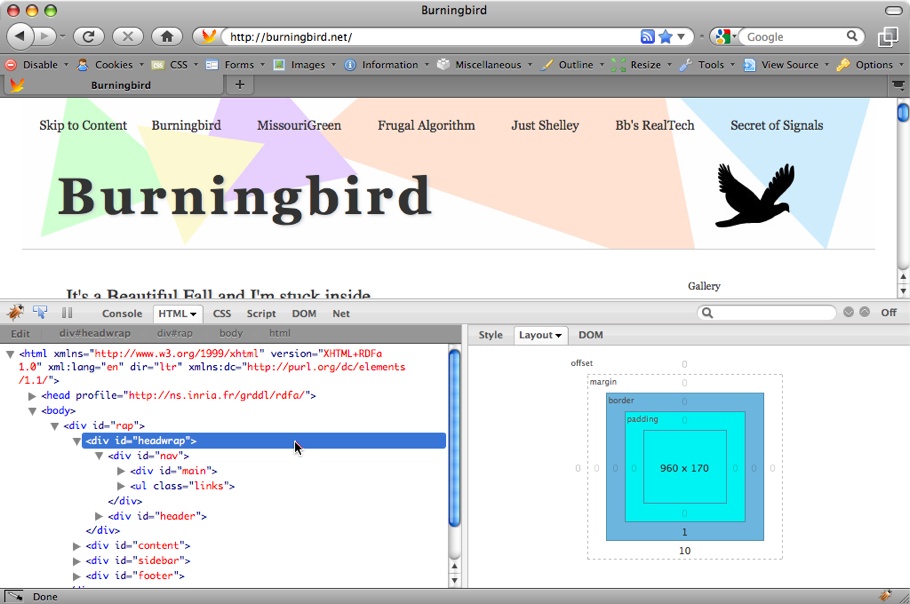
In the HTML tab, you can view the page’s element tree, clicking any element in the tree to highlight the element in the page, as shown in Figure 10-5. Notice the Style, Layout, and DOM options in the right panel. The Layout tab is currently checked, and shows the width, borders, and padding.
The HTML tab is a good way to check your web page to see which element you need to access or modify with your JavaScript application.
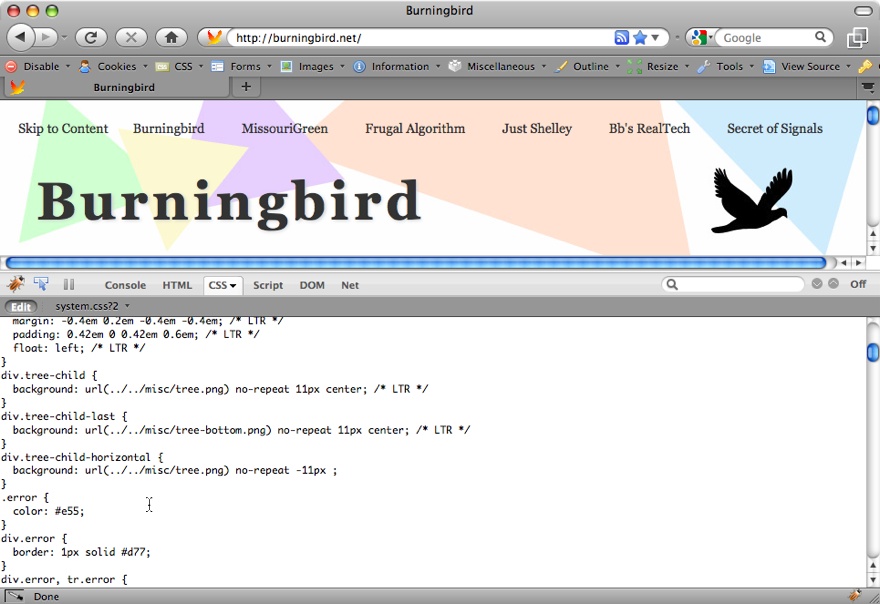
The CSS tab shows the CSS currently set for the web page. You can also edit the CSS by clicking the Edit option, as shown in Figure 10-6. Again, handy if you’re setting CSS to work with your JavaScript application. If there is more than one CSS stylesheet, you can select which one to display from a drop-down menu.
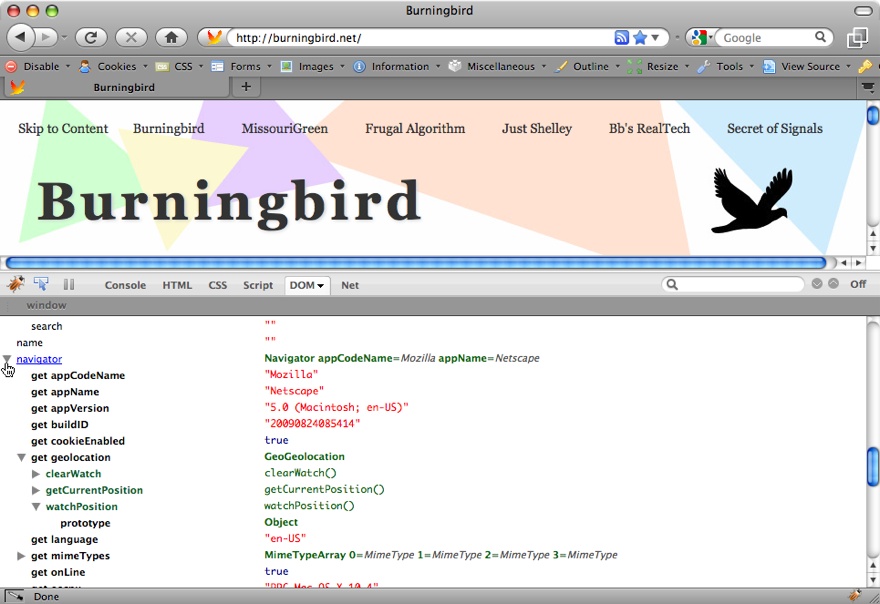
The DOM inspector provides descriptions of the DOM for all of the page elements. This includes all the properties and methods, which makes a terrific in-page reference for all the functionality you need when you’re building your dynamic page applications, as shown in Figure 10-7.
If the Panels are not enabled when you open Firebug, you can enable them by right-clicking the little Firebug icon in the status bar. Once they are enabled, you can control what shows up in each panel with drop-down menus.
You can also open Firebug in a separate window, via the Firebug icon menu. Opening the debugger in a separate window is handy if you don’t want to take up page real estate with a debugger.
See Also
Download Firebug from http://getfirebug.com/. Estelle Weyl wrote a nice tutorial on Firebug at http://www.evotech.net/blog/2007/06/introduction-to-firebug/. There’s also a Firebug Lite for use with other browsers, but I’ve found that each browser’s one native debugger to be sufficient. If you want to try it, though, download it from http://getfirebug.com/lite.html.
10.7. Setting a Breakpoint and Examining Data with Firebug
Problem
You want to stop program execution in Firefox and check out the program variables at the time.
Solution
Set a breakpoint in Firebug and use the Watch Expression panel to examine the data.
Discussion
JavaScript breakpoints can be set by clicking the line where you want the breakpoint to be set, as shown in Figure 10-8.
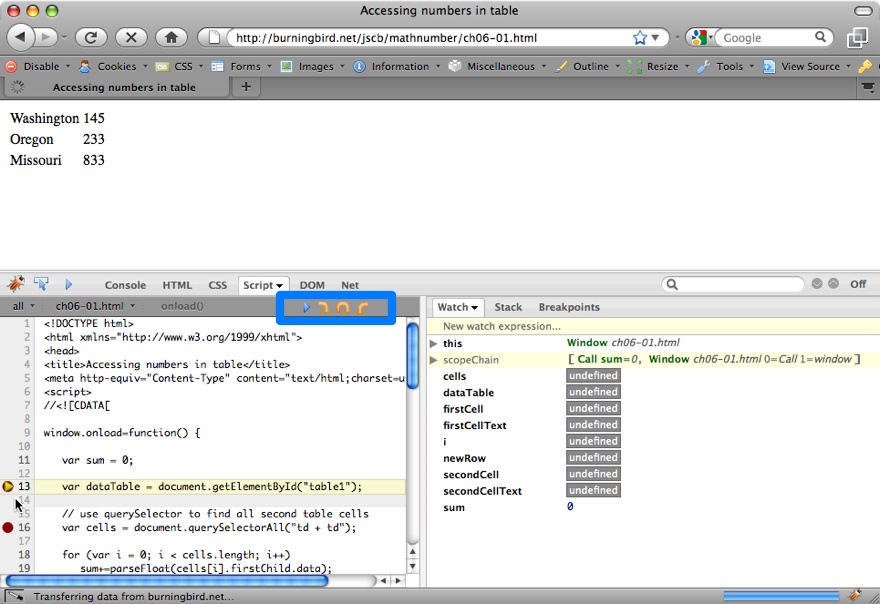
In Figure 10-8, a dark box surrounds the debugging flow controls. From left to right, the first control continues execution of the program until another breakpoint, or the application ends. The next control is Step Into, which causes the debugger to drill into any function. The next is Step Over, which would step over a function. The last is Step Out, to step out of a function.
When you set a breakpoint, you can set it to stop the program execution every time the line is reached, or you can specify a constraint by right-clicking the breakpoint and providing a constraint on the breakpoint, as shown in Figure 10-9. Most of the time, though, you’ll probably want to stop execution with each iteration.
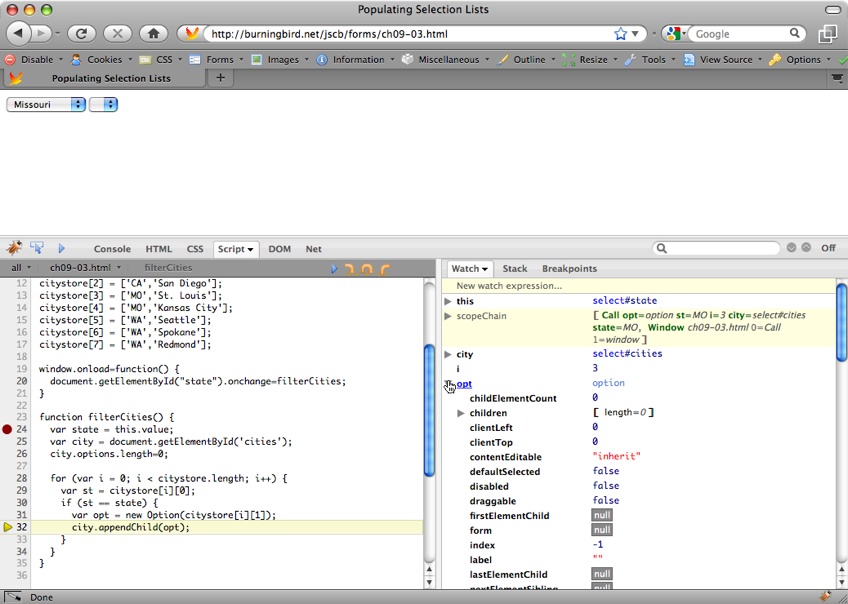
When a breakpoint is reached in Firebug, you can examine the Watch expressions, variables, and objects, the execution stack, or where current breakpoints are set (handy for very large applications) in the left panel.
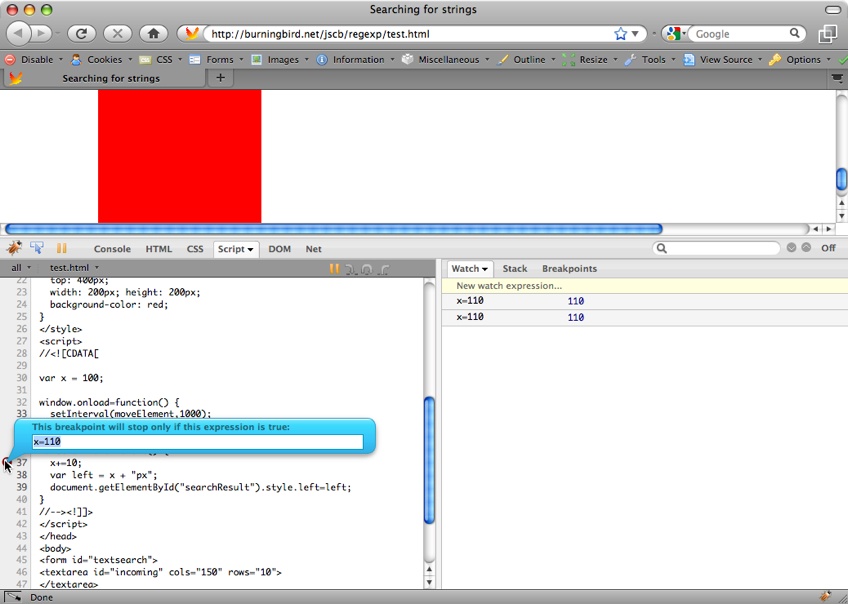
Figure 10-10 shows the Watch panel open, with several objects showing. If any of the variables have a drop-down arrow next to it, clicking the arrow displays any properties and methods of the object directly beneath the object. As you step through program execution, the objects are updated according to the program.
10.8. Firefox and the Console
Solution
Use Firebug and the Console commands to profile the JavaScript application.
Discussion
The Firebug Console object, its associated panel, and its API, are handy not only for JavaScript profiling, but for program logging, performing a trace, and other debugging.
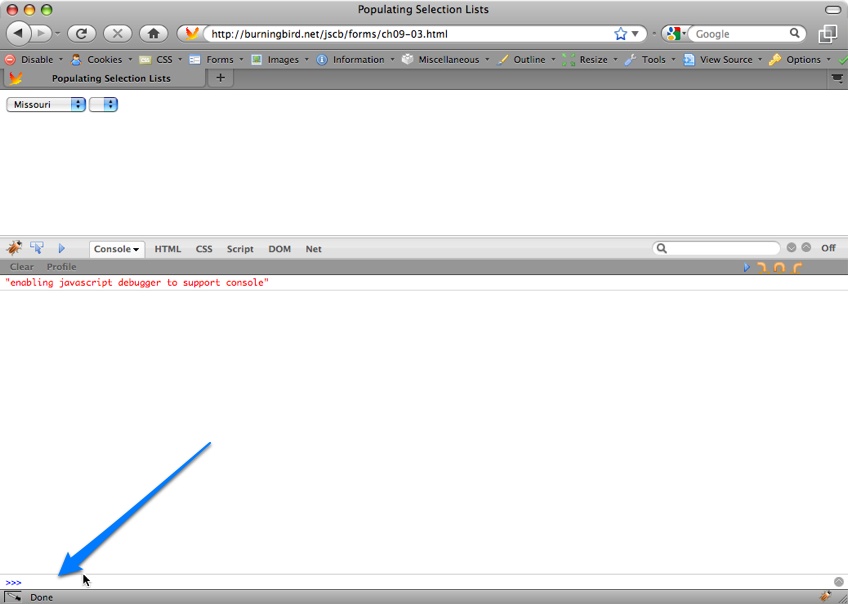
When the Console panel is enabled in Firebug, there’s a drop-down menu at the top of the panel that controls what shows up in the Console, such as CSS and XML errors, whether to turn on strict warnings, or to open a larger command line. The command line is a small line at the bottom of the Console panel, as shown in Figure 10-11.
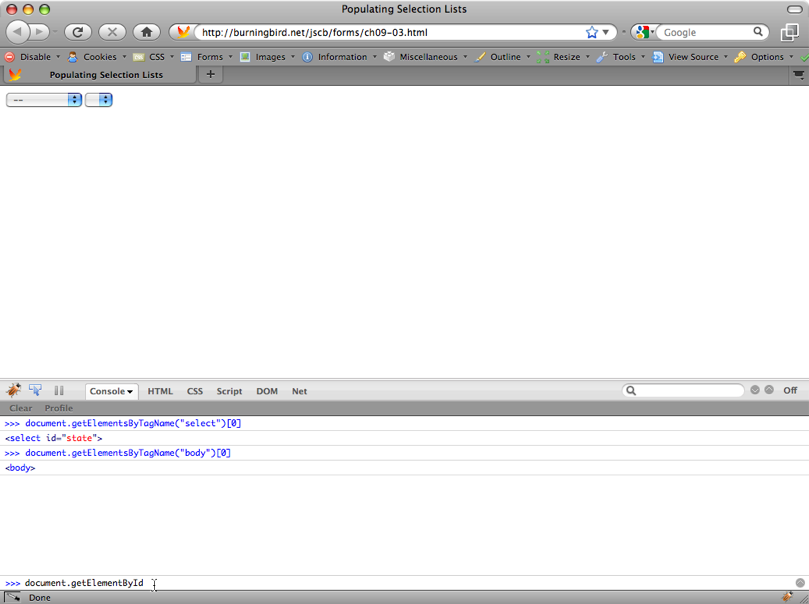
The Console command line is a way to enter Console commands (naturally). The command line isn’t for the inexperienced, but it can be a quick way to work your way around the DOM. It also has an “autofill” capability: if you start to type in a DOM element, as shown in Figure 10-12, and hit the tab, you can cycle through options at any point, hitting the return when you find one you want.
Returning to the solution, to profile JavaScript, you’ll use the Console object API, not the Command Line API. The Console object API is actually controlled in your JavaScript, with commands given directly in the script. For instance, to start a JavaScript profile and give it a name of test, use the following:
console.profile('test');When you want to finish the profile, use:
console.profileEnd();
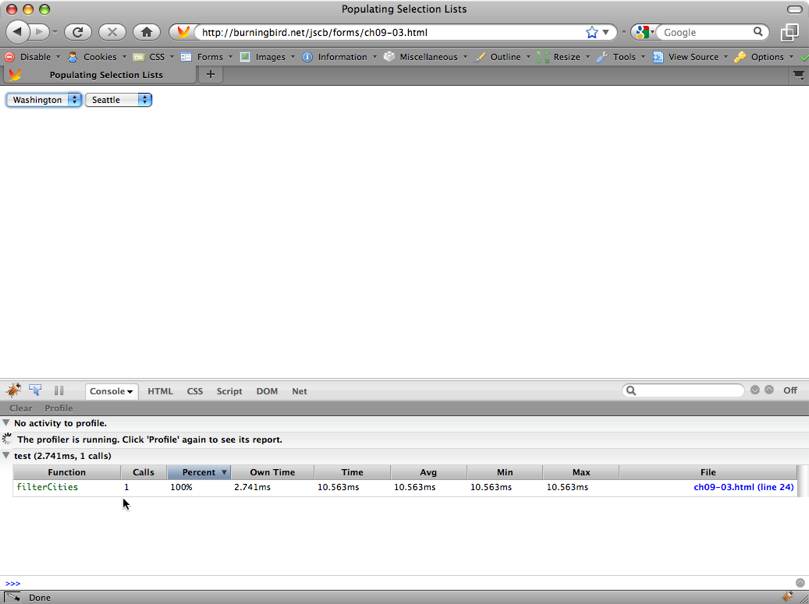
In the profile tab for the Console panel, you can see the named profiles, and if you click on each, see where time was spent in the application, as shown in Figure 10-13.
There are other Console object API methods, including console.log to log messages, console.count, which prints out the number of
times the line with this command is executed, console.time and console.timeEnd, to set up a timer to test
execution time for a block of code, and so on.
Best of all, as we’ll see later, other browser debuggers have also implemented at least partial support for the Console API.
See Also
The Console command line documentation can be found at http://getfirebug.com/cl.html, and the command line API at http://getfirebug.com/wiki/index.php/Command_Line. The console object API documentation can be found at http://getfirebug.com/wiki/index.php/Console.
10.9. Using IE’s Built-in Debugger
Problem
You’re using Internet Explorer and you want to debug your JavaScript application. You need to turn on the IE Developer Tools.
Solution
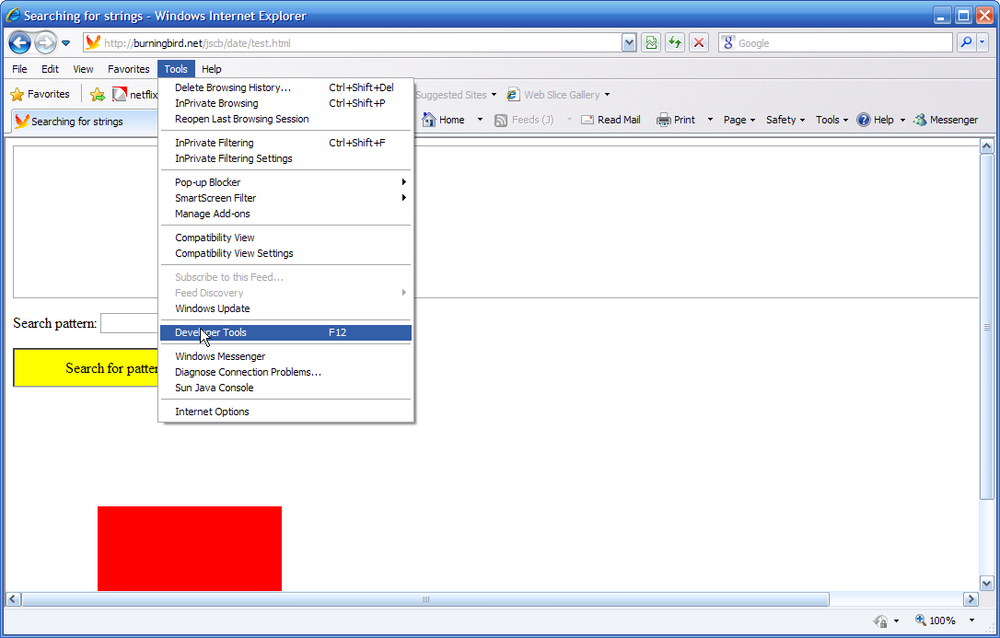
The Developer Tools, including a JavaScript debugger, can be found under Tools→Developer Tools, or by pressing F12, as shown in Figure 10-14.
Discussion
The Developer Tools that come with IE8 are as featured as you would need and provide tabbed panels for inspecting HTML, CSS, JavaScript, and JavaScript application Profiling, as shown in Figure 10-15. Don’t let references to “JScript” intimidate you: this is Microsoft’s term for JavaScript, but is more or less the same thing as “JavaScript” or even “ECMAScript” to everyone else.
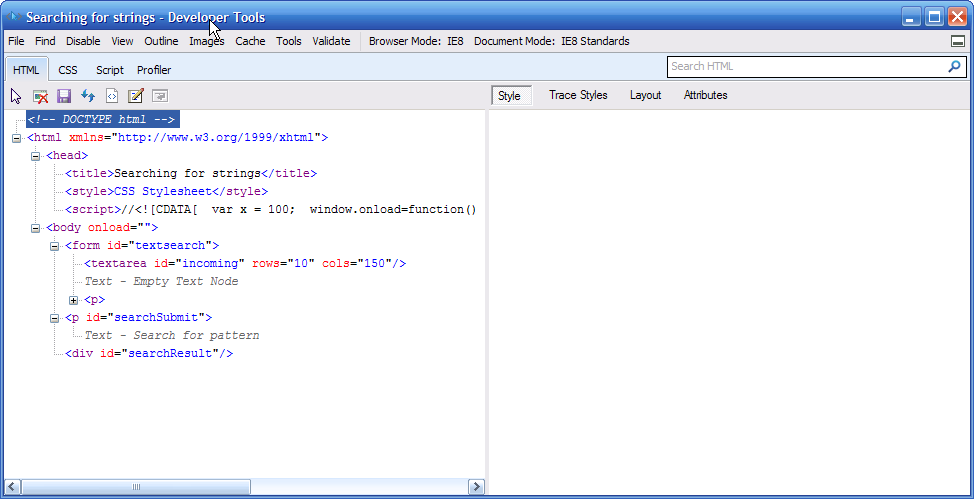
The HTML and CSS Developer Tools provide displays of HTML or CSS for the current web page. In the left panel is a display of markup or CSS for the page, and if you click on an object, properties for what you clicked display in the right panel.
As with Firebug, you can examine the layout for the page or the CSS attributes for an element. You can modify both or choose a new stylesheet, and save any edits to a new HTML or CSS file. The Profile panel is a great way of testing your web page and application performance to see where a script may be dragging, as shown in Figure 10-16.
Microsoft does support a Console API, but be forewarned: it does not operate the same as the Console API defined with Firebug and also used by WebKit. It’s only available when typing script into the Console pane; you can’t use it within the actual script itself. Handy, but not as handy as being able to place console calls into the code itself.
As for the Console pane, Figure 10-17 shows it open, with errors displayed.
See Also
Microsoft provides good documentation of the IE Developer Tools at http://msdn.microsoft.com/en-us/library/dd565622(VS.85).aspx. Be aware, though, that Microsoft moves pages around a lot, and doesn’t provide redirection in most cases. If the link provided in this book dies, try searching for “IE8 Developer Tools” to find the documentation. The high-level IE Developer page is at http://msdn.microsoft.com/en-us/ie/default.aspx. This will probably be a safe URL.
10.10. Setting a Breakpoint with IE Developer Tools
Problem
You want to halt execution of a JavaScript application at specific lines, and examine the application data at that point.
Solution
Use the IE Developer Tools Script debugger to set breakpoints in your code and then examine the data, as well as the Call Stack and Watch expressions in the right side of the script debugger.
Discussion
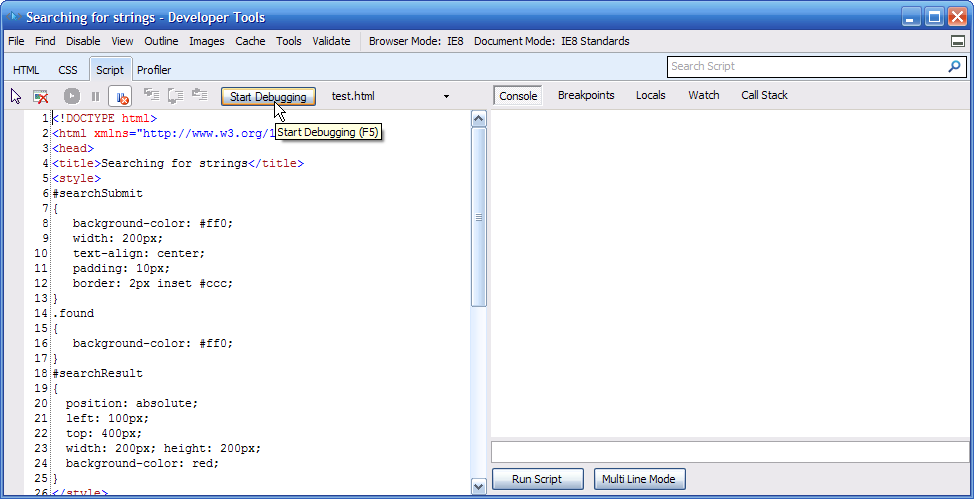
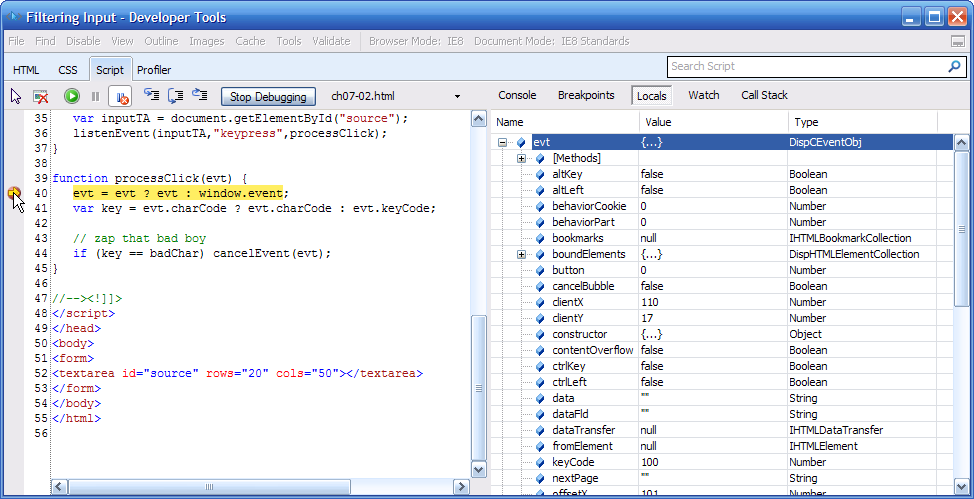
The IE Developer Tools Script debugger isn’t turned on until you do so explicitly, or you hit an error in the JavaScript and the browser asks if you want to debug the script. When you open the script, you can set a breakpoint by clicking to the left of the line where you want the breakpoint to stop, as shown in Figure 10-18.
Next to the Start/Stop Debugging button shown in Figure 10-18, you can see the
options that control program flow (Step Into, Step Over, Step Out). In
the right side of the debugger is a display of the local variables at
that point in the code execution. Currently the Event object is open, and all of its
properties and methods are displayed.
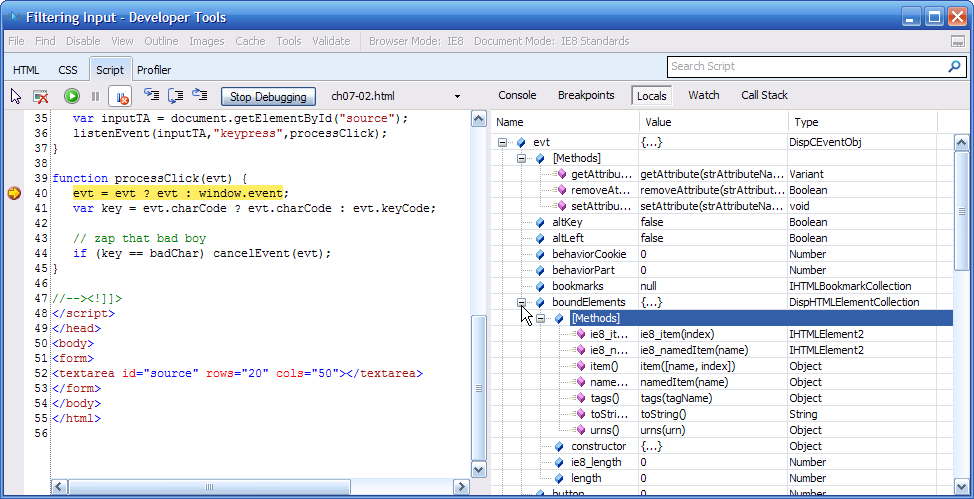
Clicking any of the methods or properties that have a plus (+) next to the name pops open the additional properties and methods nested next to the property, as shown in Figure 10-19. This nesting is typical for all of the debuggers. Otherwise, the displays could get too cluttered to see what’s happening.
10.11. Opera’s Dragonfly
Problem
Your favorite browser is Opera and you want to see what kind of debugging capability this browser has.
Solution
Use Opera’s Dragonfly for JavaScript and other debugging.
Discussion
I will say one thing: Opera has the prettiest named debugger.
As with most of the browsers these days, Dragonfly is built into Opera. You can access the tool by selecting the Tools menu, then Advanced, and Developer Tools. Dragonfly opens in the bottom half of the web page, as shown in Figure 10-20.
As with Firebug and IE’s Developer Tools, Dragonfly provides a panel for examining and working with HTML (DOM), an Error Console, a place to control the settings for the tool, a Network page, and a script debugger.
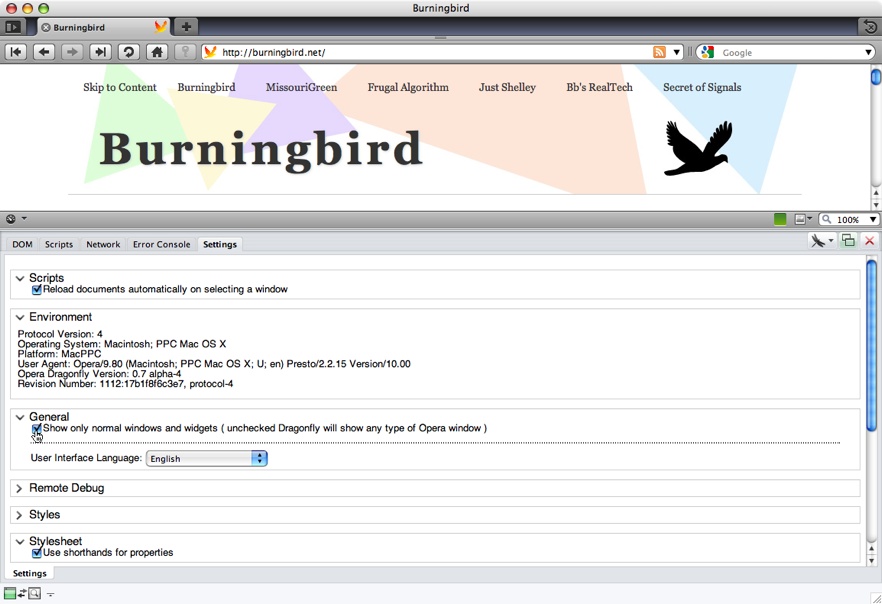
The Settings panel is rather nice, because it’s quite simple to see where to make changes, as shown in Figure 10-21.
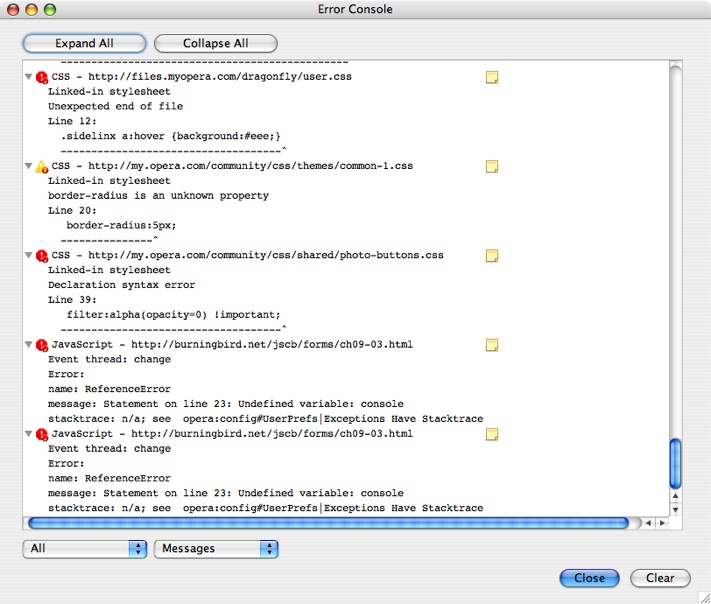
The Error Console will show JavaScript errors, CSS errors, or both, as shown in Figure 10-22. Unfortunately, at this time, Dragonfly does not support the Console API.
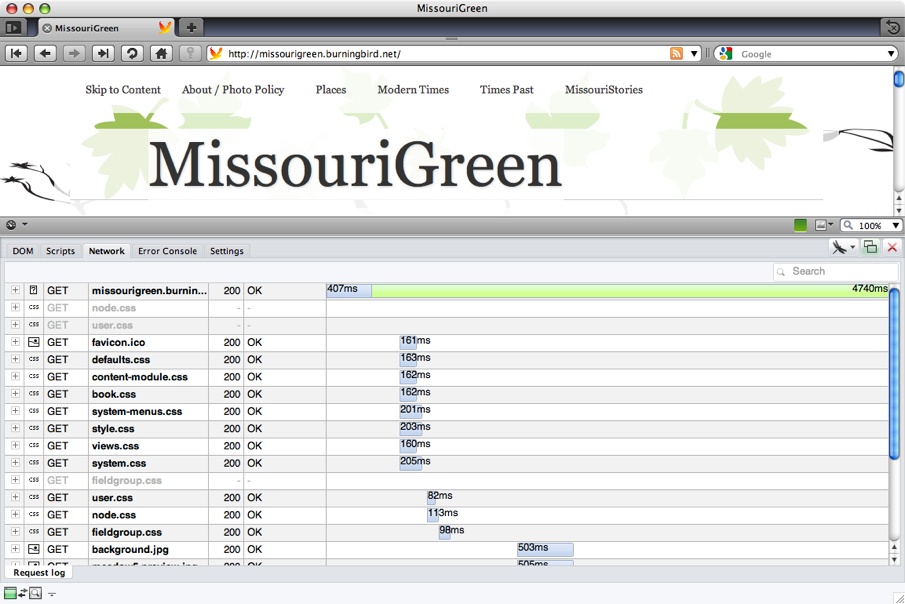
The Network page shows how long each component of the page took to load and the component’s size, as shown in Figure 10-23. Though not as colorful as Safari’s setup (as you’ll see later in this chapter), it’s nicely organized and easy to read.
As with other developing tools (except for IE’s), you can unlock the Dragonfly frame into a separate window by clicking the double window icon next to the Dragonfly icon at the top of the pane.
Clicking the Dragonfly icon reloads the debugging context, and clicking the red X closes Dragonfly.
See Also
Opera has provided a nice set of documentation for DragonFly at http://www.opera.com/dragonfly/documentation/.
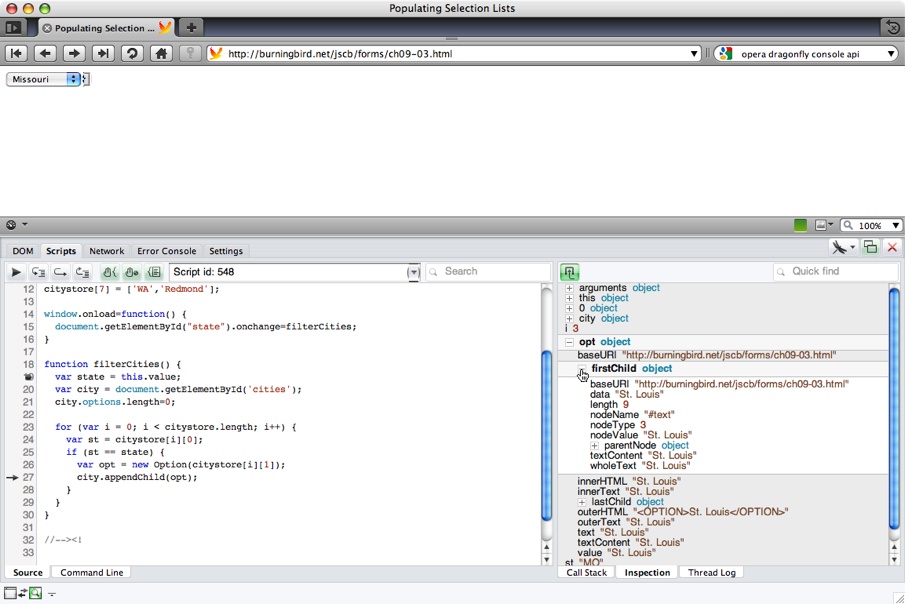
10.12. Setting a Breakpoint with Dragonfly
Solution
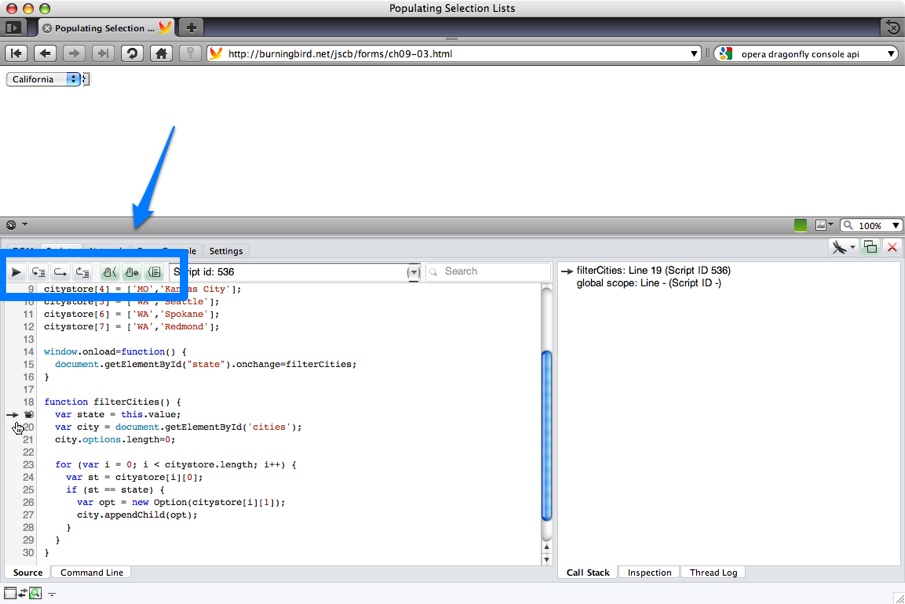
Use Dragonfly’s Scripts panel. Click the line to the left of where you want the breakpoint to be. As with all other debuggers, you have options at the top to continue script processing: Step Over, Step Into, and Step Out, as shown in Figure 10-24.
Notice the right panel in Figure 10-24. Currently, it’s set to display the current call stack. You can click the Inspection tab to view local variables as they’re set while you walk through the code, as shown in Figure 10-25.
10.13. Turning on Safari’s Development Tools
Solution
In the Preferences menu, select the Advanced option and check the option to “Show Develop menu” in menu bar.
Discussion
Safari 4 and up feature a wide variety of helpful tools for the web developer. Once you turn on the Develop menu, you’ll see options to:
Open the page in another browser
Change the User Agent signature to others, to test applications
Show Web Inspector
Show Error Console
Show Snippet Editor
Start Debugging JavaScript
Start Profiling JavaScript
Disable Caches
Disable Images
Disable Styles
Disable JavaScript
Disable Runaway JavaScript Timer
Disable Site-Specific Hacks
All of the options are handy, but I’ll focus on those useful for the JavaScript developer.
The Show Web Inspector option opens the Web Inspector into the lower portion of the browser window.
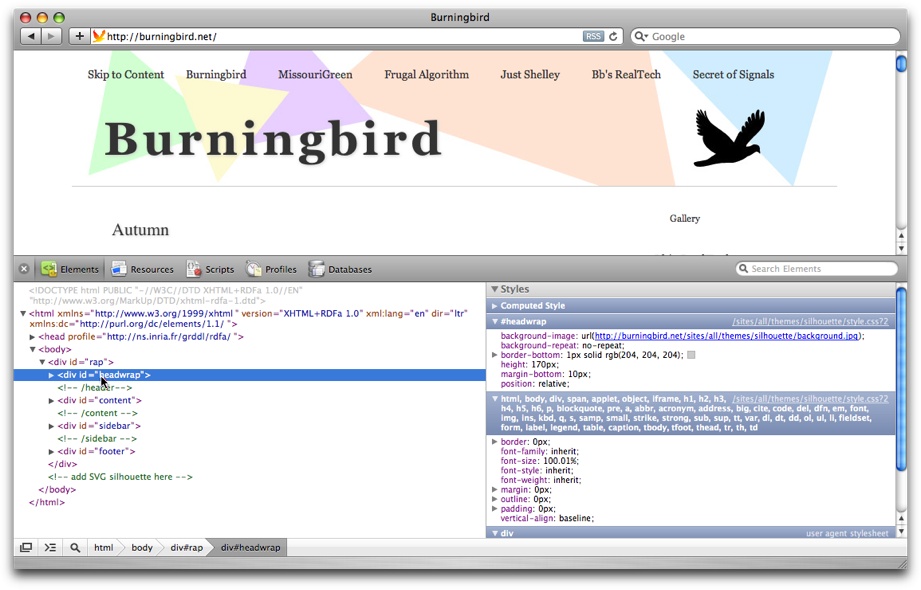
The Web Inspector is a terrific way of examining the page elements, as well as checking resource use for pages and debugging script, as shown in Figure 10-26. Moving your mouse over any of the elements shades the element in the page, making it easier to spot. The right window shows the current style setting for the element.
Most of the other options work within the Web Inspector, including the Error Console.
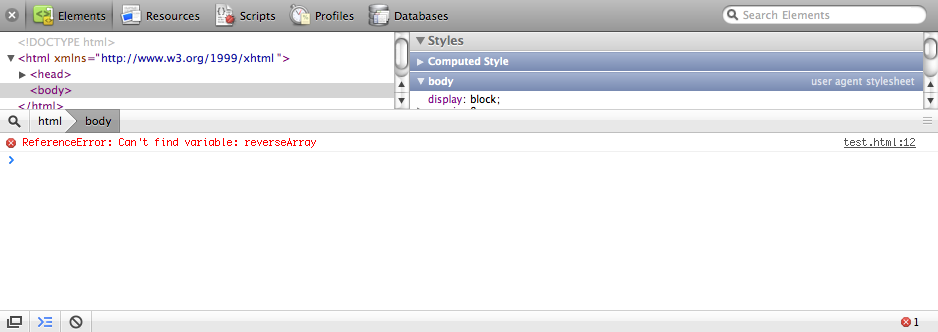
The Show Error Console will open the Web Inspector if it’s not already opened, and then an error message at the bottom. The Error Console reflects all of the JavaScript errors that occur, including the line number where the error occurred, as shown in Figure 10-27.
The ability to open the page in another browser provides a nice way to quickly open a page for testing in one of the other browsers currently available in the system. The ability to change the User Agent string is a way of testing JavaScript applications and libraries to see if the code or behavior changes based on the user agent.
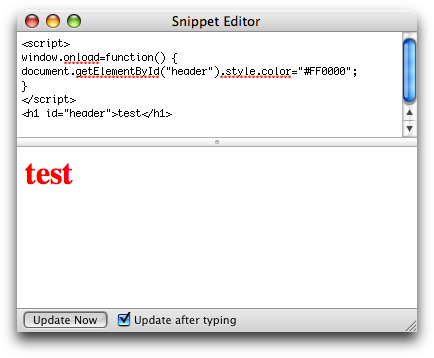
The Snippet Editor is a cute little bugger. When you click on this option, a small, double-paned window opens. You can type HTML, CSS, or JavaScript in the upper pane, and the result is displayed in the bottom pane. It’s a great way of trying out various pieces of markup or code, without having to create a web page, as shown in Figure 10-28.
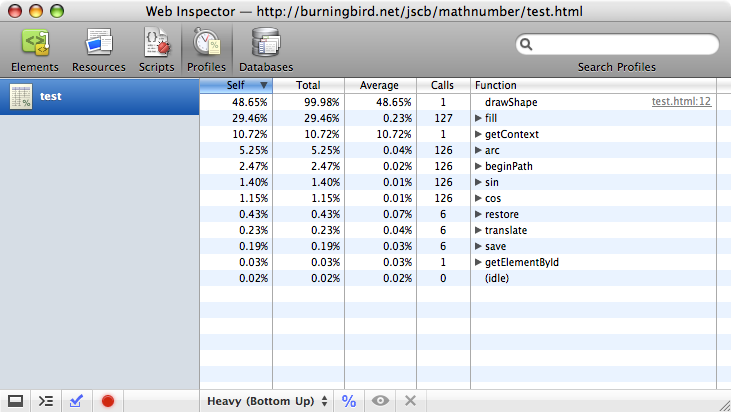
The JavaScript profile functionality provides information about
where your application is spending its time. It is compatible with the
console.profile methods described
with Firefox, and provides a nice interface to view the results. Figure 10-29 demonstrates a
profile of a small Canvas application.
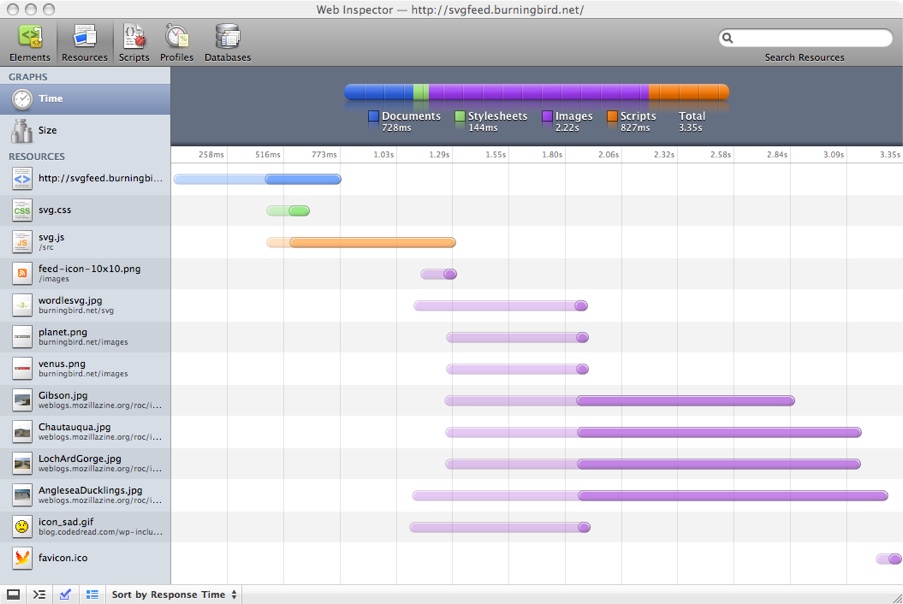
I’ll cover one last tool before getting into the JavaScript debugging in Safari: the resource window. Though not specific to JavaScript use, this handy window can provide you a good idea of why your pages may be loading slowly; it provides a breakdown of what’s loaded, and how long it’s taking. The resources tracked are JavaScript files, stylesheets, images, and the document, as shown in Figure 10-30.
See Also
The Firefox JavaScript profile functionality is covered in Recipe 10.9. For a detailed overview of the developer tools available with Safari 4, see http://www.apple.com/safari/features.html#developer.
10.14. Setting a Breakpoint with Safari’s Debugger
Solution
Set a breakpoint in Safari’s debugger, and when the breakpoint is reached, check out the program variables at that point.
Discussion
When the JavaScript debugger is open and JavaScript loaded, you can set a breakpoint by clicking to the left of the line number for the line where you want the breakpoint to occur, as shown in Figure 10-31.
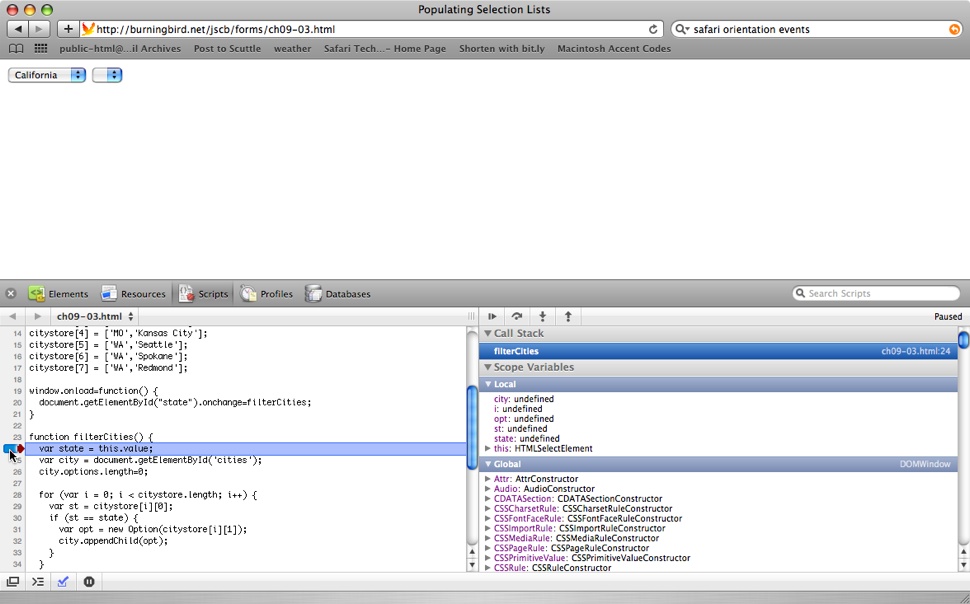
As shown in Figure 10-31, when the
breakpoint is reached, you can check out both local and global
variables, including those for DOM elements, such as
document. Clicking the arrows next to any of the
objects will open a display with the object’s methods and
properties.
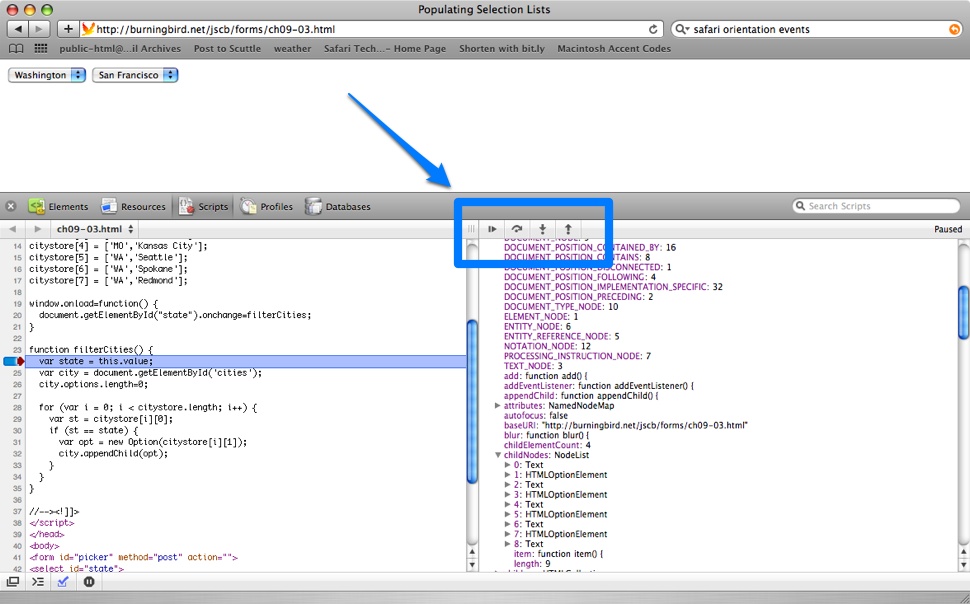
Once you’ve reached the breakpoint, you can continue program execution by using the buttons above the data panel, as shown in Figure 10-32. From the left, the buttons represent the pause/run button (to continue execution), and the Step Over, Step Into, and Step Out Of buttons for controlling how you want to handle function calls in a line. Typically, I use Step Over, because I don’t necessarily want to drill into a function: I want to see return values. However, it is a handy way of seeing what’s happening when you’re using JavaScript libraries.
Safari (or, I should say, WebKit) is the only browser that implements the console API made popular by Firebug. If you want to start a JavaScript profile in Safari, insert a console command to start the profile, as well as the end profile command.
You can then check out the profile in the Profiles panel in the debugger, as shown in Recipe 10.12, in Figure 10-29.
10.15. Debugging in Chrome
Solution
The Developer Tools for Chrome are a little hard to find because of the user interface, but if you look under the Page icon on the menu bar, you’ll see an option labeled Developer. Clicking it displays several options, including Debug JavaScript and JavaScript Console. Clicking the Debug JavaScript option opens the Web Inspector, including JavaScript Developer.
Discussion
Chrome is based on WebKit, so the same web inspector and debugging tools made available in WebKit are also available in Chrome. Once you’ve turned on the debug option, you’ll see set of panels (as shown in Figure 10-33) that will look familiar if you’ve worked with recent versions of Safari.
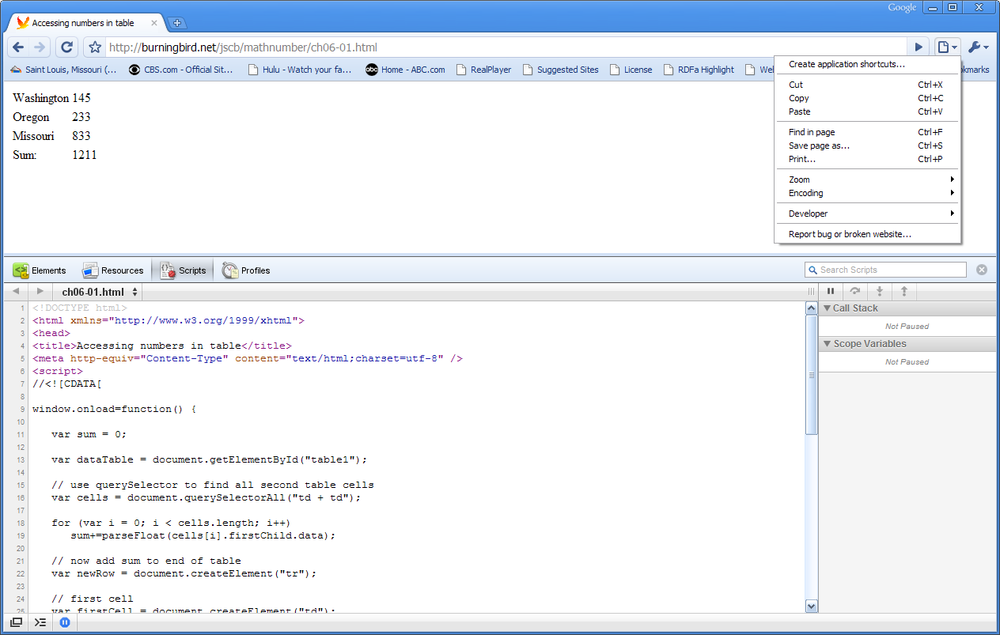
You can set breakpoints, examine data, inspect HTML and CSS, and create JavaScript profiles—basically, all of the functionality you expect from web developer tools.
See Also
The debugger for Chrome is the WebKit debugger, so I’ll refer you to Recipe 10.13, on how the debugger is used to debug JavaScript in Safari.
Get JavaScript Cookbook now with the O’Reilly learning platform.
O’Reilly members experience books, live events, courses curated by job role, and more from O’Reilly and nearly 200 top publishers.

