Chapter 5. Templates for Reporting Performance Measures
The reporting framework must accommodate the requirements of different levels in the organization and the reporting frequency that supports timely decision making. Set out below are some better practice formats which will help speed up this vital step.
Electronic templates can be acquired from www.waymark.co.nz (for a small fee). Readers who provide additional formats to KPIformats@waymark.co.nz that are not already on the website will be able to get a discount on this fee providing Waymark Solutions decides to use them and are given the right to publish them. See www.waymark.co.nz for details.
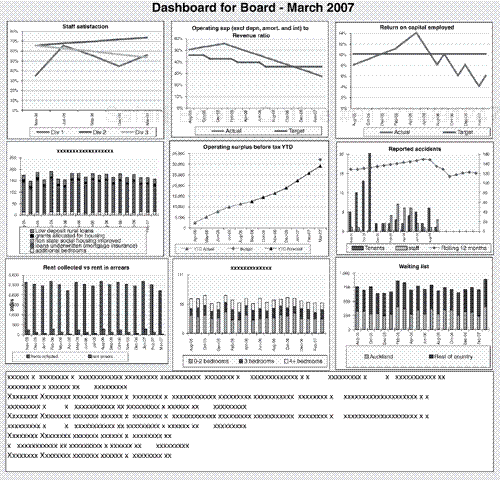
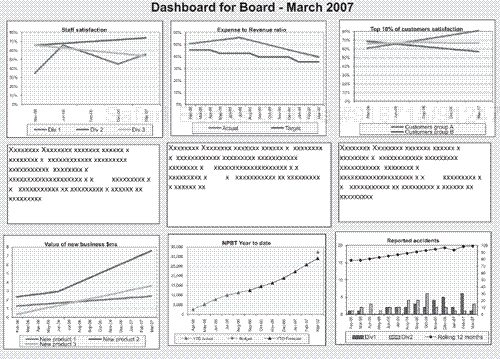
Reporting Key Result Indicators in a “Dashboard” to the Board
A dashboard should be a one-page display such as the two examples in Exhibits 5.1 and 5.2. The commentary should be included on this page.

Figure 5.1. Nine-Graph Dashboard Example

Figure 5.2. Six-Graph Dashboard Example
A good dashboard with the key result indicators (KRIs) going in the right direction will give confidence to the board that management knows what it is doing and the “ship” is being steered in the right direction. The board can then concentrate on what they do best, focusing on the horizon for icebergs in the first-class lounge instead of parking themselves on the “bridge” ...
Get Key Performance Indicators: Developing, Implementing, and Using Winning KPIs now with the O’Reilly learning platform.
O’Reilly members experience books, live events, courses curated by job role, and more from O’Reilly and nearly 200 top publishers.

