October 2016
Beginner
28 pages
19m
English
Interpretation Sheet
Directions: To interpret your results, graph the totals from the four columns, A, B, C, and D, from the scoring sheet onto the charts below. If your exact score is not shown, simply mark your score in the approximate percentile block.
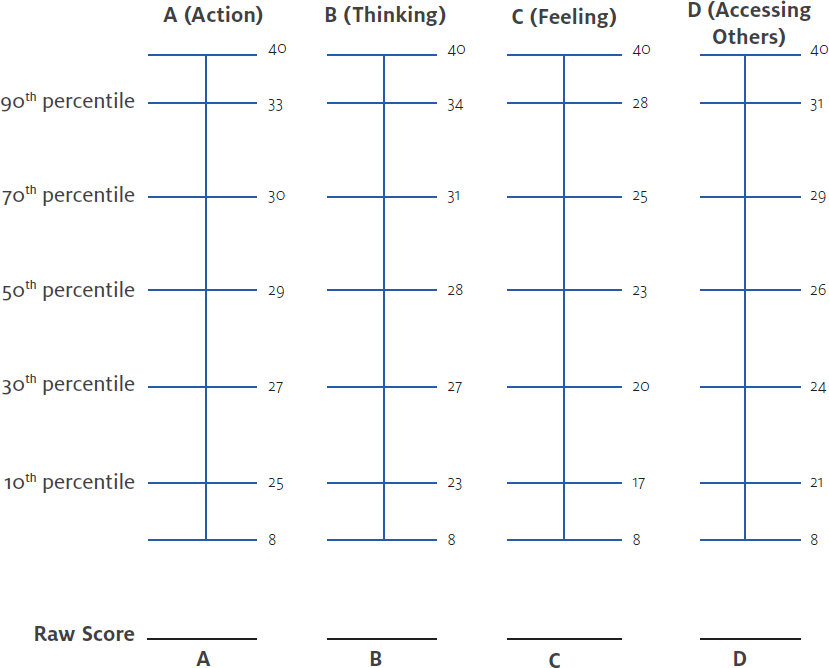
Look for scores that fall below the 50th percentile. These reflect tactics that you use less frequently than does half of the population in the database. Return to your questionnaire and identify all of the statements on which you gave yourself 1’s or 2’s. Record those tactics in the space below.
Tactics rarely used:
Reflect on how your failure to use these tactics has influenced ...
Read now
Unlock full access


