Chapter 15. System Management Tools
Mac OS X comes with many tools for tweaking and spying on various aspects of your system, including memory, kernel modules, and kernel state variables. Some of these tools come directly from BSD, while others are unique to Mac OS X. Most of the BSD-derived utilities have been filtered through Mach and NeXTSTEP on their way to Mac OS X.
For more details on any of these utilities, see their respective manpages.
Diagnostic Utilities
Mac OS X includes many diagnostic utilities that you can use to monitor your system and investigate problems.
top
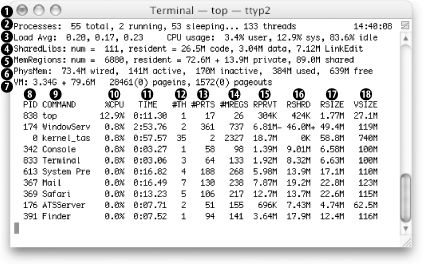
The top utility displays memory statistics and a list of running processes. It is divided into two regions: the top region contains memory statistics, and the bottom region contains details on each process.
You can specify the number of processes to show by supplying a
numeric argument. By default, top refreshes its
display every second and sorts the list of processes by process ID
(PID) in descending order. You can set top to
sort by CPU utilization with
-
u, and you can specify the
refresh delay with the -s option. Figure 15-1 shows the output of top
-u
10 (if you wanted to
refresh the output every 3 seconds, you could run
top
-s3
-u
10).

Figure 15-1. Sample output from top
Table 15-1 describes the values shown in the top region, and Table 15-2 describes the columns in the bottom region (process information). ...
Get Mac OS X Panther for Unix Geeks, Second Edition now with the O’Reilly learning platform.
O’Reilly members experience books, live events, courses curated by job role, and more from O’Reilly and nearly 200 top publishers.

