October 2011
Intermediate to advanced
142 pages
4h 15m
English
At the very end of the previous chapter, we quickly presented an example of classification. We used heights and weights to predict whether a person was a man or a woman. With our example graph, we were able to draw a line that split the data into two groups: one group where we would predict “male” and another group where we would predict “female.” This line was called a separating hyperplane, but we’ll use the term “decision boundary” from now on, because we’ll be working with data that can’t be classified properly using only straight lines. For example, imagine that your data looked like the data set shown in Figure 3-1.
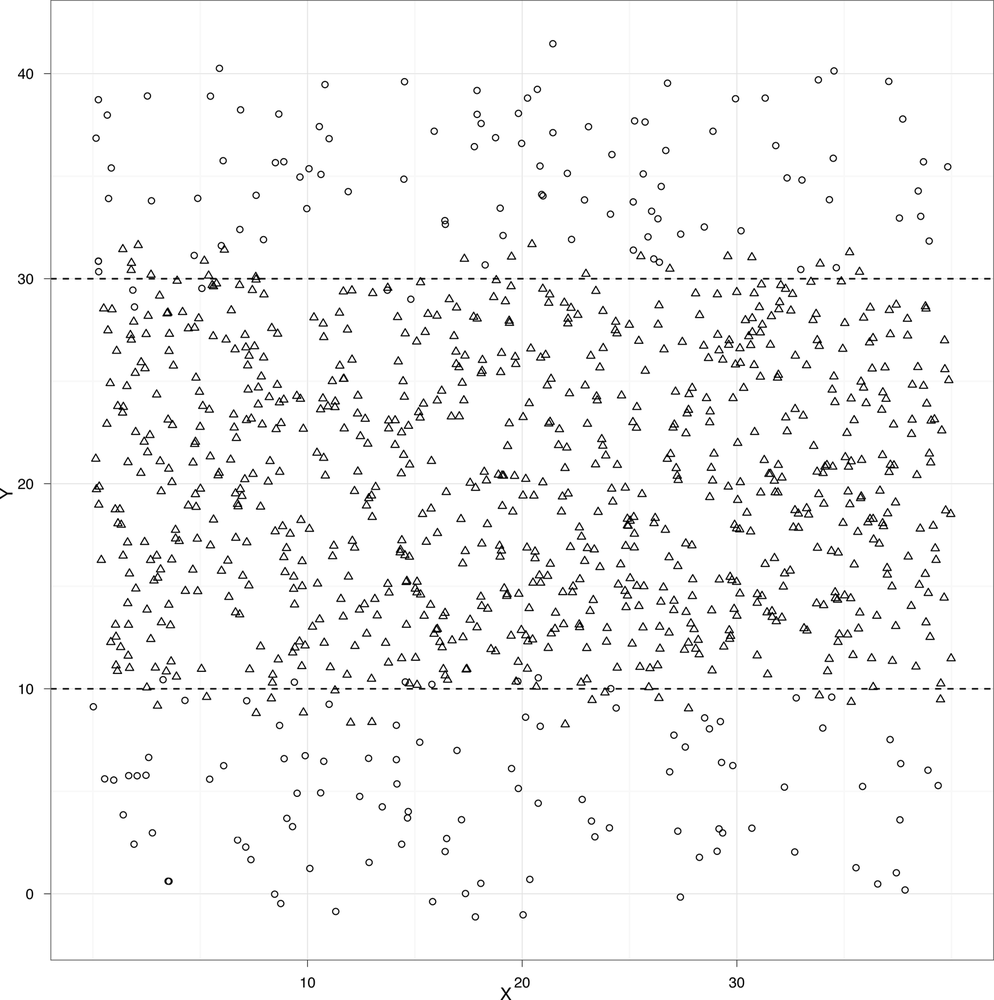
This plot might depict people who are at risk for a certain ailment and those that are not. Above and below the black horizontal lines we might predict that a person is at risk, but inside we would predict good health. These black lines are thus our decision boundary. Suppose that the open circles represent healthy people and the open triangles represent people who suffer from a disease. If that were the case, the two black lines would work quite as a decision boundary for classifying people as healthy or sick.
But before we begin to understand how these decision boundaries are determined in practice, let’s review some of the big ...
Read now
Unlock full access


