Chapter 1. Graphics Foundations: Canvas and Sprites
HTML5’s canvas element makes it
much easier to create complex graphic games, offering far more flexibility
and speed than older approaches that relied on moving images around with
the Document Object Model (DOM). Canvas lets you draw on an area of the
screen directly with JavaScript, letting you apply traditional game
graphics approaches in a web
context. Though it’s a recent addition to the HTML universe, canvas is widely supported
on newer desktop and mobile browsers.
Working with the canvas Object
The canvas element allows us to
define an extremely fast drawable region on the screen that can be
controlled using JavaScript with pixel-level accuracy. However, canvas works in immediate
mode. Unlike Scalable Vector Graphics (SVG, not covered in
this book), the calls that we make to the HTML5
Canvas API draw the graphics directly in the canvas, without
holding any reference to them once they are displayed. If we want to
move our graphics 10 pixels to the right, we need to clear the display
and redraw them using the new coordinates. Later on, we discuss a
technique called “adaptive tile refresh” that avoids having to clear the
whole display just to modify a small part of the canvas.
You can look at the canvas
object as if it were a piece of paper; you have many crayons (among
other tools) that you can use to draw things on it. So if, for example,
you want to draw a red line, grab the red crayon and draw the line. If
you want to draw a green line, grab the green crayon. Same thing goes
for your drawing “style.” If you want to draw a 45° line that goes from
the top left to the bottom right, you can either draw it without moving
the paper at all, or tilt the paper 45° to the right and draw a straight
line from the top to the bottom. (Obviously, the first approach is more
efficient.)
Accessing the HTML5 Canvas API is pretty easy. First, add the new
HTML5 canvas tag to your page and
then assign an id attribute to
it:
<canvas id="game" width="100" height="100">
Your browser doesn't include support for the canvas tag.
</canvas>The text inside the canvas tag
will be shown to the browsers that do not support the object. Later, you
will learn how to discover and handle those sorts of incompatibilities
more efficiently using a JavaScript library called Modernizr.
Note
You need to specify the width
and height attributes inside the
canvas tag.
Even though you can force canvas to
a certain width and height with CSS, when you reference the object
using JavaScript, it will return the default size (300×150 pixels),
completely overriding any values that you may have assigned via CSS.
However, you can modify the width and height of
an HTML Canvas object dynamically in JavaScript.
In order to start using the HTML5 Canvas API, we just need to
reference the canvas tag by using its
id attribute value (myCanvas), which will allow us to get a
reference to the 2D drawing context. (The “3D Context” is WebGL, which
is not covered in this book.)
window.onload = function () {
var canvas = document.getElementById('game');
var c = canvas.getContext('2d');
}Alternatively, you can create an HTML5 Canvas object dynamically:
window.onload = function () {
var canvas = document.createElement('canvas');
var c = canvas.getContext('2d');
}In the previous example code, the reference to the 2D drawing
context is stored in the c variable (in many
other examples, this variable might be called ctx). All further calls to the canvas API will
be done through this variable. As an initial example, we’re going to
work on the very first thing that users will see when they load our
game: The Title Screen. Later on, we’re going to
extend it to support the preloading of resources such as images or
sounds.
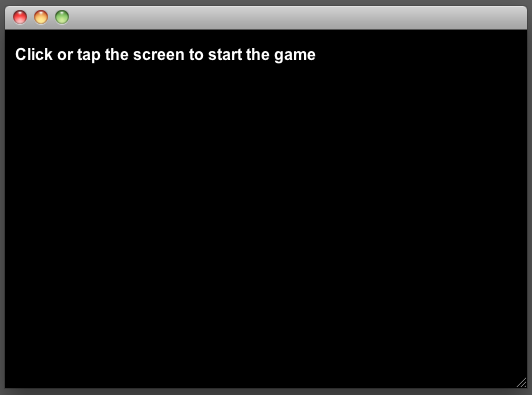
Our title screen, which will be displayed throughout the entire browser window, will consist of an image showing the logo of our game and a text below it with the phrase “Click or tap the screen to start the game.” When you click on the browser window, the title screen will smoothly fade to white.
In order to get started with this, we need to add the basic HTML code that will support the game. In most cases, the page is going to look like a conventional HTML5 page:
<!DOCTYPE html>
<html lang="en">
<head>
<meta charset="UTF-8" />
<title>Example 1 - Title Screen</title>
<script>
// Javascript code goes here
</script>
<style type="text/css" media="screen">
html { height: 100%; overflow: hidden }
body {
margin: 0px;
padding: 0px;
height: 100%;
}
</style>
</head>
<body>
<canvas id="game" width="100" height="100">
Your browser doesn't include support for the canvas tag.
</canvas>
</body>
</html>The small CSS block in the previous code allows us to force the
page to be 100 percent of the height of the window, and overflow: hidden prevents vertical and
horizontal scrollbars from showing up if we exceed the visible area on
the screen.
Now that our page template is complete, we can start using the
HTML5
      Canvas
API by adding the following JavaScript code inside the
<script> tag of our
page:
window.onload = function () {
  var canvas = document.getElementById('game');

  // Force canvas to dynamically change its size to
  // the same width/height as the browser window
  canvas.width = document.body.clientWidth;
  canvas.height = document.body.clientHeight;

  var c = canvas.getContext('2d');

  // Fill the screen with a black background
  c.fillStyle = '#000000';
  c.fillRect (0, 0, canvas.width, canvas.height);

  var phrase = "Click or tap the screen to start the game";
  c.font = 'bold 16px Arial, sans-serif';
  c.fillStyle = '#FFFFFF';
  c.fillText (phrase, 10, 30);
}
Let’s go through this code step by step.
When we added the canvas tag to
the HTML code, we defined the height
and the width attributes with the
value 100, meaning that the canvas
should be 100 pixels tall and 100 pixels wide. However, we wanted our
title screen to be as tall and wide as the browser window, which is why
we needed to override those two values dynamically by using document.body.clientWidth to indicate the
width and document.body.clientHeight to indicate the
height.
After we get a reference to the 2D context, we make a call to an
HTML5 Canvas API function called fillStyle(). At the beginning of this chapter,
we made a comparison of the canvas to a piece of paper with crayons of
different colors; this is the same scenario. What the fillStyle() call is doing is to set the color
to black, and after that it draws a filled rectangle starting at
position (0,0) and ending at position (canvas.width, canvas.height), thus covering the entire
browser window. (Remember that we set a new size for the canvas object in the last step.)
Then it sets the phrase that we’re going to use, selects a font
family (in this case, Arial with a fallback to sans-serif, which works
exactly as in CSS) and size, and changes the color again, this time to
white. The fillText() call prints the
phrase on the position 10, 30 (10 pixels starting on the left, 30 pixels
starting on the top).
Figure 1-1 shows the result of that code.
The HTML5 Canvas API also includes a very useful method called
measureText(phrase) that returns the width (in pixels) of the
phrase parameter. We also need to be careful
to measure the text after we set the size of the
font, not before. Using measureText(), we can center the text on the
screen:
var phrase = "Click or tap the screen to start the game";
c.font = 'bold 16px Arial, sans-serif';
var mt = c.measureText(phrase);
var xcoord = (canvas.width / 2) - (mt.width / 2);
c.fillStyle = '#FFFFFF';
c.fillText (phrase, xcoord, 30);
So far we have painted the canvas black, and we specified only
hexadecimal color values as the parameter for the fillStyle() method. Other styles supported by
canvas are:
Color keywords such as ‘red’ or ‘black’
RGB values in the format
rgb(Red, Green, Blue)RGBA values in the format
rgba(Red,Green,Blue,Alpha), where theAlphaparameter (the transparency) goes from 0.0 to 1.0HSL values in the format
hsl(Percentage,Percentage,Percentage)HSLA values in the format
hsla(Percentage,Percentage,Percentage,Alpha)
If solid colors aren’t enough for you, canvas also makes it possible to:
Display a linear gradient by using
createLinearGradient()Display a radial gradient by using
createRadialGradient()Display an image/canvas or video pattern by using
createPattern()
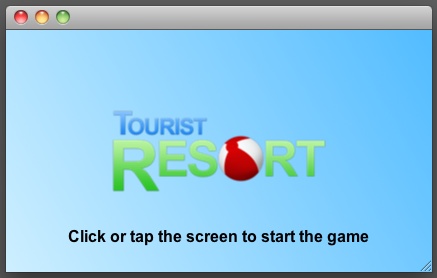
In order to change the example so that it displays a nice blue gradient instead of a black background, we can use the following code:
var grd = c.createLinearGradient(0, 0, canvas.width, canvas.height);
grd.addColorStop(0, '#ceefff');
grd.addColorStop(1, '#52bcff');

c.fillStyle = grd;
c.fillRect(0, 0, canvas.width, canvas.height);
Displaying images on the canvas is just as easy as displaying text
using the drawImage() method:
var img = new Image();
img.src = 'image.png';
c.drawImage(img, 0, 0, img.width, img.height);
Note
In order to use the img.width
and img.height attributes, the
img.readyState property must be
equal to COMPLETE. In the final
game implementation, we’ll take care of this with a resource loader
The resource loader can be found within the game.js folder of the code repository (the
file is called resourceLoader.js).
The drawImage() method of the
HTML5 Canvas API has three different implementations. Although we’ll be
covering most of them in the following sections, a more detailed
document explaining each implementation can be found here: http://www.w3.org/TR/2dcontext/#dom-context-2d-drawimage.
If we want to make our image twice as big as the original size, we just need to multiply its size by 2 in the following way:
var img = new Image();
img.src = 'image.png';
c.drawImage(img, 0, 0, img.width * 2, img.height * 2);
In our case, we’re going to use a file provided in the official code repository within the img directory, called logo.png. We’re also going to present the image so that it fills 50% of the browser window while maintaining its width/height aspect ratio so that it can be displayed gracefully in mobile phones or tablets as well as conventional desktop computers.
To present the title screen, make a function called showIntro() that displays the blue gradient,
the image, and the text:
function showIntro () {
  var phrase = "Click or tap the screen to start the game";

  // Clear the canvas
  c.clearRect (0, 0, canvas.width, canvas.height);

  // Make a nice blue gradient
  var grd = c.createLinearGradient(0, canvas.height, canvas.width, 0);
  grd.addColorStop(0, '#ceefff');
  grd.addColorStop(1, '#52bcff');

  c.fillStyle = grd;
  c.fillRect(0, 0, canvas.width, canvas.height);

  var logoImg = new Image();
  logoImg.src = '../img/logo.png';

  // Store the original width value so that we can keep
  // the same width/height ratio later
  var originalWidth = logoImg.width;

  // Compute the new width and height values
  logoImg.width = Math.round((50 * document.body.clientWidth) / 100);
  logoImg.height = Math.round((logoImg.width * logoImg.height) / originalWidth);

  // Create an small utility object
  var logo = {
      img: logoImg,
      x: (canvas.width/2) - (logoImg.width/2),
      y: (canvas.height/2) - (logoImg.height/2)
  }

  // Present the image
  c.drawImage(logo.img, logo.x, logo.y, logo.img.width, logo.img.height);

  // Change the color to black
  c.fillStyle = '#000000';
  c.font = 'bold 16px Arial, sans-serif';

  var textSize = c.measureText (phrase);
  var xCoord = (canvas.width / 2) - (textSize.width / 2);

  c.fillText (phrase, xCoord, (logo.y + logo.img.height) + 50);
}
Calling the showIntro()
function will display the image shown in Figure 1-2.
Now that our main “title screen” is ready, let’s work on the
routine that makes the screen fade to
white. To accomplish this, we’re going to use a function called fadeToWhite() that will call itself every 30
milliseconds until the entire screen is covered in white.
If we want to paint an area with a specific opacity, there are two approaches that we can use:
Specify a fill color in RGBA or HSLA
Change the
globalAlphaparameter in the 2D Context to a value between 0.0 (transparent) and 1.0 (solid)
The globalAlpha parameter
(which is the approach that we’ll be using) allows us to specify with
how much opacity elements should be displayed on the screen from that
point on. Once we set an opacity of, for example, 0.5, all other
fillRects, fillTexts, drawImages, and similar calls will be 50%
translucent.
The fadeToWhite() function will
look like this:
function fadeToWhite(alphaVal) {
  // If the function hasn't received any parameters, start with 0.02
  var alphaVal = (alphaVal == undefined) ? 0.02 : parseFloat(alphaVal) + 0.02;

  // Set the color to white
  c.fillStyle = '#FFFFFF';
  // Set the Global Alpha
  c.globalAlpha = alphaVal;

  // Make a rectangle as big as the canvas
  c.fillRect(0, 0, canvas.width, canvas.height);

  if (alphaVal < 1.0) {
    setTimeout(function() {
      fadeToWhite(alphaVal);
    }, 30);
  }
}
All that is left for us to do now is to attach the click and
resize events. The complete Example 1-1, shown
here, can also be downloaded from the official repository, where you’ll
be able to find it as ex1-titlescreen.html inside the examples folder. For the sake of brevity,
some functions such as fadeToWhite()
and showIntro() are empty, as they
were just shown.
<!DOCTYPE html>
<html lang="en">
  <head>
    <meta charset="UTF-8" />
    <title>Example 1 - Title Screen</title>

    <script>
      window.onload = function () {
        var canvas = document.getElementById('myCanvas');
        var c = canvas.getContext('2d');

        var State = {
          _current: 0,
          INTRO: 0,
          LOADING: 1,
          LOADED: 2
        }

        window.addEventListener('click', handleClick, false);
        window.addEventListener('resize', doResize, false);

        doResize();

        function handleClick() {
          State._current = State.LOADING;
          fadeToWhite();
        }

        function doResize() {
          canvas.width = document.body.clientWidth;
          canvas.height = document.body.clientHeight;

          switch (State._current) {
            case State.INTRO:
                showIntro ();
                break;
          }
        }

        function fadeToWhite(alphaVal) {
          // ...
        }

        function showIntro () {
          // ...
        }
      }
    </script>
    <style type="text/css" media="screen">
      html { height: 100%; overflow: hidden }
      body {
        margin: 0px;
        padding: 0px;
        height: 100%;
      }
    </style>

  </head>
  <body>
    <canvas id="myCanvas" width="100" height="100">
      Your browser doesn't include support for the canvas tag.
    </canvas>
  </body>
</html>
Although in this case, the animation being performed (the fade to white) is not too complex, if you run more complex animation examples on a mobile device, you will probably notice small interruptions in the animation, an effect called “frame skipping.”
Creating Smooth Animations
In any sort of game development, it’s critical to make the most
efficient use of resources. However quickly canvas may be able to draw elements on the
screen, we still need to clear or redraw a large area several times per
second; although the game perhaps won’t feel “jerky” on personal
computers, mobile devices such as cell phones or tablets could struggle
to keep up, which would completely ruin the game experience for our
players. (Later in this chapter, you will learn how to dramatically
improve performance.)
The enormous variety of devices that will be able to play our game means that if we need to present a simple animation, some devices might be able to show them at 90 frames per second (FPS) while others could be doing only 15 FPS.
Example 1-2 shows a simple test that can tell us approximately how capable a device is.
<!DOCTYPE html>
<html lang="en">
  <head>
    <meta charset="UTF-8" />
    <title>Canvas Example 2 (FPS Count)</title>

    <script>
      window.onload = function () {
        var canvas = document.getElementById('myCanvas');
        var c = canvas.getContext('2d');

        var fpsArray = [];
        var fpsCount = 0;
        var stopAt = 10;
        var fps = 0;
        var startTime = 0;

        var date = new Date();
        startTime = Math.round(date.getTime() / 1000);

        c.font = '20px _sans';

        draw(startTime);

        function draw (timeStamp) {
          var date = new Date();
          ts = Math.round(date.getTime() / 1000);

          if (timeStamp !== ts) {
            fps = fpsCount;
            fpsCount = 0;
            fpsArray.push(fps);
          } else {
            fpsCount++;
          }

          c.fillStyle = '#000000';
          c.fillRect (0, 0, canvas.width, canvas.height);

          c.fillStyle = '#FFFFFF';
          c.fillText ("TS: " + timeStamp, 10, 20);
          c.fillText ("FPS: " + fps, 10, 40);

          if (timeStamp <= (startTime + stopAt)) {
            setTimeout(function() {
                draw(ts);
            }, 1);
          } else {
            showResults(c, canvas);
          }
        }

        function showResults() {
          var mean = 0;
          var sum = 0;

          c.fillStyle = '#FFFFFF';
          c.fillRect (0, 0, canvas.width, canvas.height);

          // sort the samples
          for (var i = 0; i < fpsArray.length; i++) {
            for (var j = fpsArray.length - 1; j > i; j--) {
                if (fpsArray[j - 1] > fpsArray[j]) {
                fpsArray[j - 1] = fpsArray[j];
              }
            }
          }

          // discard the first value, which is usually very low
          fpsArray = fpsArray.slice (1, fpsArray.length);

          for (var i = 0; i < fpsArray.length; i++) {
            sum = sum + fpsArray[i];
          }

          mean = sum / fpsArray.length;

          c.fillStyle = '#000000';
          c.fillText ("MIN: " + fpsArray[0], 10, 20);
          c.fillText ("MAX: " + fpsArray[fpsArray.length - 1], 10, 40);
          c.fillText ("MEAN: " + (Math.round(mean * 10) / 10), 10, 60);
        }
      }
    </script>

  </head>
  <body>
    <canvas id="myCanvas" width="160" height="70" style="border: 1px solid black;">
      Your browser doesn't include support for the canvas tag.
    </canvas>
  </body>
</html>
Example 1-2
repaints the same canvas object as many times as it can per second for
10 seconds, keeping track of the frame rate. You will notice that in
this particular example (at the time of writing this book), Google
Chrome and Opera have almost four times better performance than Firefox,
Safari, or IE9. Chrome or Opera aren’t that much faster than the rest,
but there is an artificial limitation in the setTimeout() and setInterval() functions. In most browsers, 10
ms (milliseconds) is the minimum value, but in Chrome and Opera, it is 4
ms. These artificial limitations are set to prevent the browser from
locking up and are defined in the W3C Working Draft (http://www.w3.org/TR/html5/timers.html).
A more “browser-friendly” approach is to use the requestAnimFrame function (because the HTML5
spec is still being developed, each browser engine has given this
function its own name). Using requestAnimFrame allows the browser to decide
when it is the best time to show the next frame. For example, if we
minimize the browser window and nothing else depends on the call to
requestAnimFrame, the browser could
decide to stop the animation until we restore the window to a visible
state.
Inside the examples folder in
the code repository of this book, you will find instructions on how to
perform the same task (calculating FPS) using both approaches (ex2-fps-requestAnimationFrame.html and
ex2-fps-setTimeout.html). You can
track the progress of timing control for script-based animations in the
W3C Editor’s Draft (see http://webstuff.nfshost.com/anim-timing/Overview.html
and http://www.w3.org/TR/2011/WD-animation-timing-20110602/).
The ex2-fps-requestAnimationFrame.html file
implements a shim, a routine that checks whether a
given function is implemented by the web browser—and if it isn’t, falls
back to another, developed by Paul Irish (http://paulirish.com). It checks whether the browser
currently supports requestAnimFrame()
and falls back to setTimeout() if it
doesn’t.
In the following examples and throughout our game, we will stick
with the setTimeout() approach, as it
gives us more fine-grained control over when to call the next frame. For
example, instead of calling the setTimeout() function every 1 or 10 ms, we
might decide that it’d be more efficient to call it every 500 or 2000
ms. Although at the time of writing this book, it is not completely
supported across all browsers, in the future the final requestAnimFrame() function will allow us to
specify a time parameter.
Note
requestAnimFrame is capped at
60 FPS.
As we have seen so far, depending on the capabilities and the performance of the device (among other factors), we will get a higher or lower FPS—which means that if we base our animations by the number of frames, the animations will be played faster on some devices than on others.
Note
Those familiar with PCs in the 1980s may remember the “turbo” button, which allowed you to change the clock speed of the processor. In the past, many games and applications were developed to run at a specific clock speed, so as computers got faster, all the variables in those games, including the animations, got faster as well, leading to hilarious results. The button allowed us to “slow down” the computer to support old applications such as games.
To prevent this variance, we are going to use a “time-based” approach for animations, in which it doesn’t matter how many FPSs our device can process but will rather allow us to specify that an animation should be played within a specific time value, ignoring how many frames that animation actually has.
Working with Sprites
In order to demonstrate this idea, we’re going to use an Sprite class, which loads images from a sprite sheet. Sprites are individual game textures that may have one (static) or multiple frames (animated). Usually, in order to optimize load and memory lookup times, most of the images in our game will be placed in a single (and large) image file called a sprite sheet. The sprite sheet that we will be using can be seen in Figure 1-3.
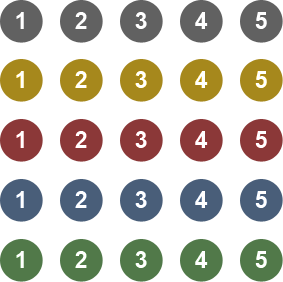
The sprite sheet contains 25 graphics grouped in 5 groups of 5 graphics each, which means that in this case it contains 5 different animations. What we are going to do is to define that the first animation should last 5 seconds; the second should last 2.5 seconds; the third should last 1.6 seconds; the fourth should last 1.25 seconds; and the final one should last only 1 second. Example 1-3 shows how to implement this concept.
<!DOCTYPE html>
<html lang="en">
  <head>
    <meta charset="UTF-8" />
    <title>Canvas Example 3 (Sprite Animations)</title>

    <script charset="utf-8" src="sprite.js"></script>
    <script>
      var fpsCount = 0;
      var fps = 0;
      var startTime = 0;

      var Timer = function() {
        this.date = new Date();
      }

      Timer.prototype.update = function() {
        var d = new Date();
        this.date = d;
      }

      Timer.prototype.getMilliseconds = function() {
        return this.date.getTime();
      }

      Timer.prototype.getSeconds = function() {
        return Math.round(this.date.getTime() / 1000);
      }

      window.onload = function() {
        var canvas = document.getElementById('myCanvas');
        var c = canvas.getContext('2d');

        // Initialize our sprites
        var spritesheet = '../img/sprite1.png';

        var gray = new Sprite(spritesheet, 60, 60, 0, 0, 5, 5000);
        var yellow = new Sprite(spritesheet, 60, 60, 0, 60, 5, 2500);
        var red = new Sprite(spritesheet, 60, 60, 0, 120, 5, 1666);
        var blue = new Sprite(spritesheet, 60, 60, 0, 180, 5, 1250);
        var green = new Sprite(spritesheet, 60, 60, 0, 240, 5, 1000);

        var timer = new Timer();

        c.font = '14px _sans';

        var startTime = timer.getSeconds();
        draw(startTime);

        function draw (timeStamp) {
          timer.update();

          if (timeStamp !== timer.getSeconds()) {
            fps = fpsCount;
            fpsCount = 0;
          } else {
            fpsCount++;
          }

          c.fillStyle = '#FFFFFF';
          c.fillRect (0, 0, canvas.width, canvas.height);

          c.fillStyle = '#000000';

          gray.setPosition(40, 60);
          gray.animate(c, timer);
          gray.draw(c);

          yellow.setPosition(80, 100);
          yellow.animate(c, timer);
          yellow.draw(c);

          red.setPosition(120, 140);
          red.animate(c, timer);
          red.draw(c);

          blue.setPosition(160, 180);
          blue.animate(c, timer);
          blue.draw(c);

          green.setPosition(200, 220);
          green.animate(c, timer);
          green.draw(c);

          c.fillText ("Elapsed Time: " + (timeStamp - startTime) + " Seconds", 10, 20);
          c.fillText ("FPS: " + fps, 10, 40);

          setTimeout(function() {
            draw(timer.getSeconds());
          }, 1);
        }
      }
    </script>

  </head>
  <body>
    <canvas id="myCanvas" width="300" height="300" style="border: 1px solid black;">
      Your browser doesn't include support for the canvas tag.
    </canvas>
  </body>
</html>sprite.js, which we’ll be using in this and other sections, looks like this:
var Sprite = function(src, width, height, offsetX, offsetY, frames, duration) {
    this.spritesheet = null;
    this.offsetX = 0;
    this.offsetY = 0;
    this.width = width;
    this.height = height;
    this.frames = 1;
    this.currentFrame = 0;
    this.duration = 1;
    this.posX = 0;
    this.posY = 0;
    this.shown = true;
    this.zoomLevel = 1;

    this.setSpritesheet(src);
    this.setOffset(offsetX, offsetY);
    this.setFrames(frames);
    this.setDuration(duration);

    var d = new Date();
    if (this.duration > 0 && this.frames > 0) {
          this.ftime = d.getTime() + (this.duration / this.frames);
    } else {
          this.ftime = 0;
    }
}

Sprite.prototype.setSpritesheet = function(src) {
    if (src instanceof Image) {
          this.spritesheet = src;
    } else {
          this.spritesheet = new Image();
          this.spritesheet.src = src;
    }
}

Sprite.prototype.setPosition = function(x, y) {
    this.posX = x;
    this.posY = y;
}

Sprite.prototype.setOffset = function(x, y) {
    this.offsetX = x;
    this.offsetY = y;
}

Sprite.prototype.setFrames = function(fcount) {
    this.currentFrame = 0;
    this.frames = fcount;
}

Sprite.prototype.setDuration = function(duration) {
    this.duration = duration;
}

Sprite.prototype.animate = function(c, t) {
    if (t.getMilliseconds() > this.ftime) {
          this.nextFrame ();
    }

    this.draw(c);
}

Sprite.prototype.nextFrame = function() {
    if (this.duration > 0) {
          var d = new Date();

          if (this.duration > 0 && this.frames > 0) {
               this.ftime = d.getTime() + (this.duration / this.frames);
          } else {
               this.ftime = 0;
          }

          this.offsetX = this.width * this.currentFrame;

          if (this.currentFrame === (this.frames - 1)) {
               this.currentFrame = 0;
          } else {
               this.currentFrame++;
          }
    }
}

Sprite.prototype.draw = function(c) {
    if (this.shown) {

          c.drawImage(this.spritesheet,
                          this.offsetX,
                          this.offsetY,
                          this.width,
                          this.height,
                          this.posX,
                          this.posY,
                          this.width * this.zoomLevel,
                          this.height * this.zoomLevel);
    }
}
You’ll be able to find an additional example in the code repository named ex3-sprite-anim-alt.html. A screenshot of this example can be seen in Figure 1-4.
What’s at that Pixel?
Another great feature of the HTML5 Canvas is that it allows us to
access, or set, the pixel-level information of an image, giving us the
possibility of finding out the RGBA values of a specific pixel inside
it. The way to do this is by using the context.getImageData() or context.putImageData() methods, which take the
following parameters:
context.getImageData(x, y, width, height);
getImageData() returns an
object called “ImageData” that contains the following fields:
width(read-only)The width of the image, expressed in pixels
height(read-only)The height of the image, expressed in pixels
dataA
CanvasPixelArrayobject (an array) containing all the pixels inside the image, where each pixel is formed by groups of four indexes (R, G, B and A). To access the blue value of the first pixel, callImageData.data[2]. To access the red value of the second pixel, callImageData.data[4], and so on.
A common iteration going through all the values of an ImageData.data array of the whole canvas would
look like this:
var img = context.getImageData(0, 0, canvas.width, canvas.height);
var idata = img.data; // It's important to save this value
                      // to a new array for performance reasons

for (var i = 0, idatal = idata.length; i < idatal; i += 4) {
  var red = idata[i + 0];
  var green = idata[i + 1];
  var blue = idata[i + 2];
  var alpha = idata[i + 3];
}
If instead of accessing image data, you want to insert it into the canvas, you can use:
context.putImageData(ImageData.data, x, y);
or its alternative implementation:
context.putImageData(ImageData.data, x, y, dx, dy, dw, dh);
where the parameters would be:
ImageData.dataA
CanvasPixelArrayobject (the pixel array)xOrigin point of the X axis (upper-left corner) where the
CanvasPixelArraywill be paintedyOrigin point of the Y axis (upper-left corner) where the
CanvasPixelArraywill be painted- [Optional]
dx(“Dirty X”) The horizontal value at which to place the
CanvasPixelArrayin the canvas- [Optional]
dy(“Dirty Y”) The vertical value at which to place the
CanvasPixelArrayin the canvas- [Optional]
dw(“Dirty Width”) Allows you to specify the width of the
CanvasPixelArraybefore being painted onto the canvas (for example, specifying original width/2 would shrink the image horizontally by 50%)- [Optional]
dh(“Dirty Height”) Allows you to specify the height of the
CanvasPixelArraybefore being painted onto the canvas (for example, specifying original height/2 would shrink the image vertically by 50%)
Note
In order to locally try the following examples in this chapter,
you might need to pass on a parameter called --allow-file-access-from-files to the Google
Chrome, Firefox, or Opera binaries upon startup in order to bypass a
security constraint concerning the same-origin policy (each file://
has its own policy).
For more information about this constraint, visit the relevant W3C spec at http://dev.w3.org/html5/spec/Overview.html#security-with-canvas-elements.
Safari doesn’t have this constraint.
Example 1-4 shows how to
apply the getImageData() function in
a practical context, where we can use it to detect the color of a
particular pixel inside an image.
<!DOCTYPE html>
<html lang="en">
  <head>
    <meta charset="UTF-8" />
    <title>Canvas Example 4 (Detecting Colors)</title>

    <script>
      window.onload = function () {
        var preview = document.getElementById('preview');
        var r = document.getElementById('r');
        var g = document.getElementById('g');
        var b = document.getElementById('b');
        var a = document.getElementById('a');
        var mx = document.getElementById('mx');
        var my = document.getElementById('my');

        var canvas = document.getElementById('myCanvas');
        canvas.addEventListener('mousemove', move, false);

        var c = canvas.getContext('2d');

        var building = new Image()
        building.src = "../img/cinema.png";

        draw();

        function draw () {
          c.drawImage(building, 0, 0, canvas.width, canvas.height);
        }

        function move (e) {
          mx.innerHTML = e.clientX;
          my.innerHTML = e.clientY;

          var img = c.getImageData(e.clientX, e.clientY, 1, 1);
          var idata = img.data;

          var red = idata[0];
          var green = idata[1];
          var blue = idata[2];
          var alpha = idata[3];

          r.innerHTML = red;
          g.innerHTML = green;
          b.innerHTML = blue;

          a.innerHTML = (alpha > 0) ? alpha : 'Transparent';

           var rgba='rgba(' + red + ', ' + green + ', ' + blue + ', ' + alpha + ')';
         preview.style.backgroundColor =rgba;
        }
      }
    </script>

    <style type="text/css" media="screen">
      body { margin: 0px; padding: 0px; }

      canvas {
        border: 1px solid black;
        float: left;
      }

      ul {
        list-style: none;
        margin: 10px 10px 10px 10px;
        padding: 0px;
        float: left;
      }

      ul li { font-weight: bold; }
      ul li span { font-weight: normal; }
      ul li #preview { width: 50px; height: 50px; border: 1px solid black; }
    </style>
  </head>
  <body>
    <canvas id="myCanvas" width="300" height="300">
      Your browser doesn't include support for the canvas tag.
    </canvas>
    <ul>
      <li><div id="preview"></div></li>
      <li>Red: <span id="r">NULL</span></li>
      <li>Green: <span id="g">NULL</span></li>
      <li>Blue: <span id="b">NULL</span></li>
      <li>Alpha: <span id="a">NULL</span></li>
      <li>Mouse X: <span id="mx">NULL</span></li>
      <li>Mouse Y: <span id="my">NULL</span></li>
    </ul>
  </body>
</html>
For more information about these and other pixel manipulation functions, access the relevant W3C Working Draft section: http://www.w3.org/TR/2dcontext/#pixel-manipulation.
Dealing with Transparency
Now that you know how to get the color of a particular pixel in
the canvas, including its alpha value (the transparency), we can solve
a very common problem in web development that previously could be
solved only by using very intricate and inefficient hacks (involving
the use of JavaScript and CSS to click through the transparent areas
of a PNG image, a div, or another
element). The problem is that though some areas of the image are
transparent, they still act as a solid rectangle, and thus clicking on
the transparent areas returns a reference to the original of the image
instead of returning a reference to the next solid object below
it.
With these tools in our hands, there are many ways to solve this particular problem, but they all mostly consist of either:
Figuring out the position of the element using DOM functions and iterating through elements until we find a collision with a “solid” pixel
Keeping track of the positions where we place objects and in which order they are presented, which is the approach used in conventional game development
The first approach can be implemented by using the document.elementFromPoint() DOM function to
determine which element was clicked and if it is an image or an object
with a background (either a solid color or an image which may or may
not have transparent areas), we can use getImageData() to detect whether the
selected pixel is transparent.
If that’s the case, we can select the parent (and if it’s not, we can
look for siblings). We can keep traversing the DOM until we find a
“solid” color and select that element instead of the image. However,
this approach can be nonfunctional, impractical, or downright
inefficient if:
There are elements with a large number of siblings or parent nodes
We are overriding the z-index of parent elements and “going through” the element should select the element below it (which, in this case, would be a child node)
The second approach requires us to do things in a completely
different way than most web developers are used to: keeping track of
the coordinates of the objects we present on the screen, and upon a
click action, do a hit test to see whether the X and Y coordinates of
the mouse are inside the area of any given object. The way to do this
is to store the position x, position y, width, and height of every
element, as well as the order in which they are being presented on the
screen. Then, there are many methods that you can use to cycle through
all the elements in order to see which one you have clicked on. Having
the position x, position y, width, and height for every object that
you present allows you to create rectangles that you can later use to
test whether the clientX and
clientY values returned by a mouse
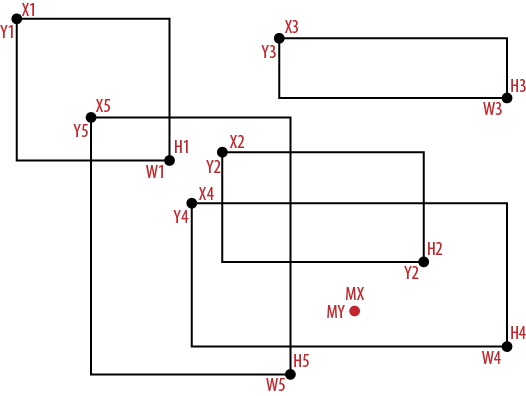
event (such as mousedown, mousemove, mouseup, click, etc.) are inside them. Figure 1-5 shows how we can keep
track of all the objects presented on the screen. MX and MY
(Mouse X and Mouse Y) represent the click
coordinates. Then we can check whether the mouse coordinates are
inside any of the other objects (in this case, the object being
clicked would be #4).
In our case, we’re going to eliminate the two downsides of using
document.elementFromPoint()
by combining it with pointer-events:
none, a CSS attribute that lets the browser know that the
mouse should not interact with an individual element, completely
eliminating the need to traverse the DOM or keeping track of every
single object in our screen.
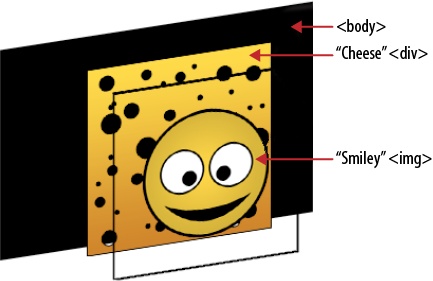
Figure 1-6 shows how our
page is going to be organized. Clicks made in the transparent areas of
the “Smiley” img should go through
the image, and we should get a reference to the “Cheese” div, unless, of course, we click through the
transparent areas of the Smiley, and a hole of the Cheese, which
should return a reference to the HTML document.
To do this, we need to start off by detecting that the page has finished loading:
window.onload = function () {
  var MIN_ALPHA_THRESHOLD = 10;

  var canvas = document.getElementById('myCanvas');
  var c = canvas.getContext('2d');

  document.addEventListener('click', detectElement, false);
Notice a variable called MIN_ALPHA_THRESHOLD, which specifies how
solid something must be (on a scale of 0–255, which is included in the
pixel-level data returned by context.getImageData()) so as to not be
considered transparent. All the clicks that we make on the document
call a function called detectElement().
The idea behind detectElement() is simple; first, we need to
detect the object returned by invoking document.elementFromPoint() and test for
transparency. If it is transparent, add the object to an array of
objects we’re going to make “invisible” to pointer events, and try
again. Keep doing that until we find a solid object or body, show the result in an alert box, and
roll back all the changes:
function detectElement (e) {
  var invisibleObjects = new Array();
  var solidPixel = false;
  var obj;

  do {
    obj = document.elementFromPoint(e.clientX, e.clientY);
    if (obj == null || obj.tagName == 'BODY' || obj.tagName == 'HTML') {
      break;
    }
    if (isTransparent(obj, e.clientX, e.clientY)) {
      invisibleObjects.push(obj);
      setObjectEventVisibility(obj, false);
    } else {
      solidPixel = true;
    }
  } while(!solidPixel);

    for (var i = 0; i < invisibleObjects.length; i++) {
      setObjectEventVisibility(invisibleObjects[i], true);
    }

    invisibleObjects = null;

  alert(obj.tagName);
}
The setObjectEventVisibility() function makes
elements visible or invisible to pointer events by passing a reference
to the object, and a boolean parameter indicating whether we want to make objects visible or invisible. All
it does is set the value of the pointerEvents CSS attribute to either visiblePainted (the default) or none. Other valid values for pointerEvents are visibleFill, visibleStroke, visible, painted, fill, stroke, all, and inherit. You can see the complete list and
what each is for in the relevant W3C specification page: http://www.w3.org/TR/SVG/interact.html#PointerEventsProperty.
Notice that we’re going to be assuming that we are not going to be
using values for pointerEvents
other than visiblePainted or
none. Extending the functionality
of the function shown here to support all other pointerEvents is left as an exercise to the
reader:
function setObjectEventVisibility(obj, visible) {
  if (visible) {
    obj.style.pointerEvents = 'visiblePainted';
  } else {
    obj.style.pointerEvents = 'none';
  }
}
The function that we’re going to be using to detect if an
specific coordinate of an image is transparent is called isPixelTransparent(). In order to make this
function work correctly, we must take into account all the different
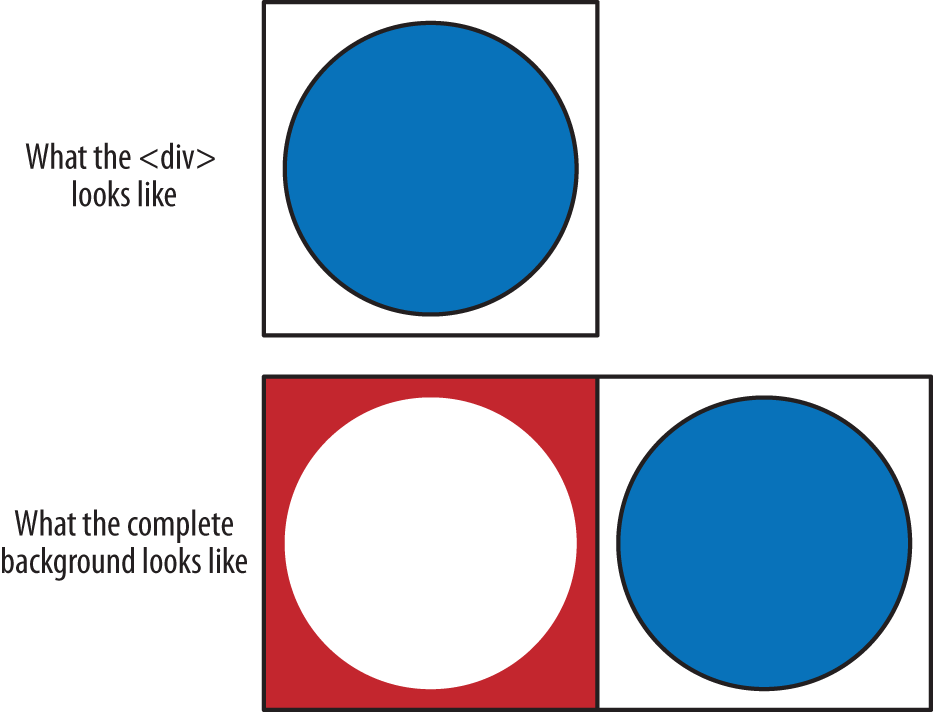
use-cases in which it will be used. For example, let’s say that we
have a 300×300-pixel div, but as a
background we are using a 600×300-pixel image with a horizontal
background offset of 300 pixels.
Figure 1-7 shows how the div could look (in reality, our background
image will be the “cheese” texture) and also shows the complete image
being used as its background. Notice that the background of that
div has a horizontal offset of 300
pixels. If we didn’t take that offset into account, clicking on the
center of the image would result in a transparent pixel instead of the
solid blue one. Another thing to keep in mind (not taken into account
in this script) is that in the case of non-img elements (such as divs), we might be using the CSS3 background-size attribute, which allows us
to adjust how the background image is presented relative to the
div that is containing it.
Therefore, in the case of non-img elements, we’re going to use the
following helper function:
function getBackgroundPosition(src, property) {
  property = property.split(' ');

  /**
   * Modifying the code to find out if its inheriting any properties
   * from a parent would be too inefficient. We're going  to be
   * assuming that if the element has 'auto', it means 0
   */
  var left = (property[0] != 'auto') ? property[0].substr(0, property[0].length - 2) : 0;
  var top = (property[1] != 'auto') ? property[1].substr(0, property[1].length - 2) : 0;

  return {
    x: left,
    y: top
  };
}
For the sake of simplicity, we’re going to assume that all background images are not being repeated either horizontally or vertically and that we will be using a single background per element (CSS3 supports multiple backgrounds). However, extending the functions to support multiple backgrounds can be done very easily by loading all of them in an array.
That said, our isPixelTransparent() function is going to
look like this:
function isPixelTransparent (src, x, y, oWidth, oHeight, offsetX, offsetY) {
    var img = new Image()
    img.src = src;

    // If parameters are not being passed on to this function, use "default" values
    oWidth = (!oWidth) ? img.width : oWidth;
    oHeight = (!oHeight) ? img.height : oHeight;
    offsetX = (!offsetX) ? 0 : offsetX;
    offsetY = (!offsetY) ? 0 : offsetY;

    // 'Reset' the canvas before painting over it again
    c.clearRect(0, 0, 1, 1);

    c.drawImage(img, offsetX - x, offsetY - y, img.width, img.height);

    var idata = c.getImageData(0, 0, 1, 1);
    var data = idata.data;
    var alpha = data[3];

    return (alpha < MIN_ALPHA_THRESHOLD);
}
Finally, the isTransparent()
function will be in charge of getting the element located at the X and
Y coordinates returned by document.elementFromPoint() and figuring out
how to interpret it before calling isPixelTransparent().
To do this correctly, we first need to calculate the relative coordinates of the click depending on the position of the object on the screen:
function isTransparent(obj, x, y) {
    var robj = obj;
    var rx = robj.x;
    var ry = robj.y;
    var offset = { x: 0, y: 0 };
    var padding = { x: 0, y: 0 };
    var margin = { x: 0, y: 0 };

    // Calculate the X (left) and Y (top) coordinates relative to the
   // parent until we get to the "top"
    if (robj.offsetParent) {
          rx = 0;
          ry = 0;

          while(robj.offsetParent) {
               rx += robj.offsetLeft;
               ry += robj.offsetTop;
               robj = robj.offsetParent;
          }
    }
In addition to the separation between the object and its parent objects, they might also have a padding or a margin defined, so we need to take that possibility into account as well. Figure 1-8 will give you an idea of what a particular scenario might look like.
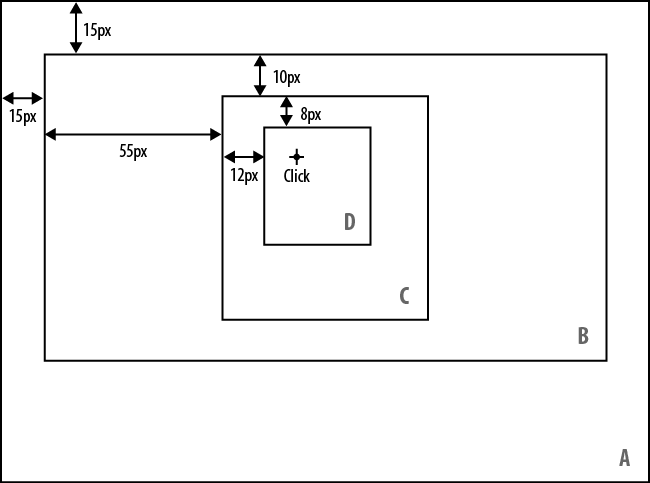
We have detected a click inside the D container, and we also know that:
document.addEventListener('click', detectElement, false);returns coordinates relative to the edges of the window (container A). Thus if we want to figure out the X and Y coordinates relative to the D container, we need to cycle through all of D’s parent containers (C and B) until we get to the top (A). In this case, that would be:
/* Pseudocode */
xCoord = Mouse.x - 12 (C) - 55 (B) - 10 (A)
yCoord = Mouse.y - 8 (C) - 10 (B) - 15 (A)
This separation between the container and all of its children could be because:
We have defined that the children should be positioned using either
position: absoluteorposition: relative, setting a top, left, right, or bottom value(s)The container has a
paddingThe children have a
margin
And so on. However, there are a few “gotchas” in which some of
these rules don’t apply. For example, if the parent container has
defined a padding but its children
are using position: absolute, they
won’t be affected by it.
Usually, to get a CSS attribute, many developers use:
document.getElementById('ObjectName').style.propertyThe problem with that approach is that it doesn’t take into
account CSS attributes defined via a CSS Stylesheet; it can be used
only when styles are defined inline. Modern browsers usually support
window.getComputedStyle. Here’s how
to access a property:
var cs = document.defaultView.getComputedStyle(obj, null);
paddingLeft = cs.getPropertyValue('padding-left');
The name of the computed styles is the same as the CSS attribute
that we’re trying to access; for example, the left padding would be
getPropertyValue('padding-left')
and a background image would be getPropertyValue('background-image').
Then we need to figure out what sort of DOM element we’re
dealing with. Images should be handled in a different way than, say, a
div or a td. Elements that do not support background images or “image
source” attributes will be considered transparent:
switch(obj.tagName) {
  case 'IMG':
    // Handle image source
    break;
  case 'DIV':
  case 'TD':
  case 'P':
  case 'SPAN':
  case 'A':    // handle background image or solid color
    break;
  default:
    return true;
    break;
}
Conventional img tags are the
easiest to handle, as the path to the image is declared in the source
attribute:
case 'IMG':
  return isPixelTransparent(obj.src, (x - rx), (y - ry), obj.width, obj.height);
  break;
However, all other elements require a trickier way to figure out if the object has a solid color or an image background—and if they do, how the image is positioned and presented inside it.
The complete code for this example is ex5-clickthrough.html in the examples folder of the code repository.
Choosing a Rendering Method for Our Graphics
Just as website download times translate to more or fewer visitors in the statistics (because faster download times reduce visitor dropoff), fluidly rendering graphics and animations on the screen should be one of the most crucial priorities when developing any sort of video game. We’ll lose a lot of players if graphics and animations are shaking all the time due to low frame rates. In isometric real-time strategy games, we’ll have to keep both things in mind, especially if we want our game to be played on mobile devices as well as desktop computers.
In isometric real-time strategy games, the most basic “objective” of the game is to place buildings on a grid. Each building will generate P amount of points every N number of seconds, which will allow us to buy additional buildings.
Although the most adequate, reliable, and performance-efficient way to draw a grid in a web browser (without using a third-party plugin) depends on the project requirements, there are four possible approaches:
We can display graphics using WebGL context of the HTML5 Canvas object, which is not covered in this book (see the note following this list).
We can also present tiles and objects as conventional HTML elements (such as
divs orimgs) and position them using the CSStopandleftproperties. There are two variations of this approach: using isometric-shaped graphics, or rotating and skewing graphics ourselves using CSS3.
We can deploy a variation of the previous approach, which consists of presenting elements in a similar fashion to the previous method, but using the new CSS3 positioning tools, such as
translateXandtranslateY—as well as settingtranslateZ(0)—to force hardware acceleration in Chrome, Safari, and Safari for the iPhone.We can use the 2D context of the HTML5 Canvas object.
Other rendering methods exist but are too inefficient to be used in the context of a video game.
Note
Although WebGL is the fastest and most efficient method to
render graphics on the screen, the reason we’re not going to consider
it as a reliable method is because, at the time of writing of this
book, the WebGL spec hadn’t reached version 1.0 and is not supported
in the release versions of Internet Explorer 9, Safari for the iPhone,
Safari, Android Web Browser, and Opera (Firefox for Android does
include support for WebGL, but it needs to be enabled manually in
about:config). Microsoft has
already stated that they won’t be supporting WebGL at all due to
security concerns (http://blogs.technet.com/b/srd/archive/2011/06/16/webgl-considered-harmful.aspx).
Additionally, WebGL is based on OpenGL ES 2.0—a competing product of
DirectX, Microsoft’s own graphic library—and also threatens
Silverlight (a Rich Internet Application, or RIA, framework for
browser-based applications). For more information about the current
status of WebGL, refer to the public mailing list on the Khronos Group
website: https://www.khronos.org/webgl/public-mailing-list/.
A few weeks before publishing this book, the most efficient way to display the grid was using the third approach, due to the hardware acceleration hack (or feature). The problem with this approach (or the second approach) is that unless we want to keep an enormous number of elements on the DOM tree (one for each tile, plus others for buildings, etc.) when we scroll, we need to constantly add and remove nodes (to display only the elements that we can see, thus keeping the node count low). Adding or removing nodes from the DOM tree triggers a computationally expensive operation on the browser called a reflow that allows the layout engine of the browser to compute the geometry of the elements inside the DOM tree. Due to the implementation of hardware acceleration in the 2D and 3D contexts, recent (and future) developments have made and will reinforce the HTML5 Canvas as the most appropriate and efficient graphics rendering method for interactive video games.
The isometric game genre works around building objects on a grid, which is nothing more than a matrix containing two dimensions: one for the “Rows,” which we’ll sometimes call the “X” axis, and another for the “Columns,” which we’ll sometimes define as the Y axis. Example 1-5 generates a matrix of 20×50 tiles (20 rows per 50 columns) using this approach.
<!DOCTYPE html>
<html lang="en">
  <head>
    <meta charset="UTF-8" />
    <title>Example 6 (Generating a 20 × 50 grid)</title>
    <script>
      window.onload = function () {
        var tileMap = [];
        var grid = {
          width: 20,
          height: 50
        };

        function initializeGrid() {
          for (var i = 0; i < grid.width; i++) {
            tileMap[i] = [];
            for (var j = 0; j < grid.height; j++) {
              tileMap[i][j] = 0;
            }
          }
        }

        initializeGrid();
      }
    </script>
  </head>
  <body>
  </body>
</html>
With the right approach, the size of the grid can be almost unlimited and shouldn’t have an impact on performance. We can resort to working with 500×500 or 1,000×1,000 fragments and then, as we are approaching the “beginning” or the “end” of the fragment, we can use a memory paging routine to load/save the fragments, either in the computer hard disk drive—in our case, the WebStorage API—or online in a database. For the sake of simplicity, for our game we will be working with a 250×250 grid (62,500 tiles) and will leave the implementation of a memory paging function as an exercise for the reader.
For the moment, we’re going to focus on displaying our grid using squares, and later on, we’ll switch to an isometric view.
Let’s suppose that we have a really big grid of 6,250,000 tiles (2,500 rows per 2,500 columns) in which each tile has a width and height of 32 pixels and the grid will be displayed in a container that has a resolution of 300×300 pixels. Over the years, when faced with a similar problem (displaying a grid on the screen several times per second), I have seen people doing these sort of things:
for (var row = 0; row < grid.length; row++) {
  for (var col = 0; col < grid[row].length; col++) {
    displayTile(row, col);
  }
}
This code cycles through every single position on the grid and
tries to display the tile without checking whether it is inside the
screen. Also, each iteration on both for loops (rows and columns) needs to check
the size of the grid and grid[row] arrays, so it’s terribly
inefficient.
Others have been a little bit more generous:
for (var row = 0, rowLength = grid.length; row < rowLength; row++) {
  for (var col = 0, colLength = grid[0].length; col < colLength; col++) {
    if (tileIsInsideScreen(row, col)) {
      displayTile(row, col);
    }
  }
}
This approach is a great performance improvement compared to the previous example. Now the size of the grid array is being stored in a variable (and therefore doesn’t need to check the element count on each iteration) and displays the tile only if it can be shown on the screen. However, the main problem remains: it still has to do 6,250,000 iterations. Surely you must be wondering if there’s a way to improve on that number. And fortunately for all of us, there is.
The trick consists mainly of iterating through only the elements
that you can display by taking into account variables such as the X/Y
offset (scroll), tile width/height,
and display area width/height in the following way:
var startRow = Math.floor(scroll.x / tile.width);
var startCol = Math.floor(scroll.y / tile.height);
var rowCount = startRow + Math.floor(canvas.width / tile.width) + 1;
var colCount = startCol + Math.floor(canvas.height / tile.height) + 1;
Then you just need to use those variables inside the loops:
for (var row = startRow; row < rowCount; row++) {
for (var col = startCol; col < colCount; col++) {
displayTile(row, col);
}
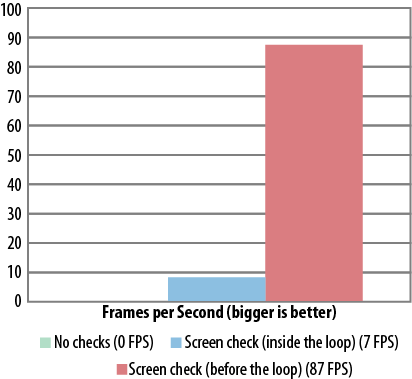
}Example 1-6 demonstrates creating a grid with this approach, and Figure 1-9 compares the results to other approaches.
<!DOCTYPE html>
<html lang="en">
  <head>
  <meta charset="UTF-8" />
    <title>Example 7 (Generating a 2500 × 2500 grid)</title>

    <script>
      window.onload = function () {
        var tileMap = [];

        var tile = {
          width: 32,
          height: 32
        }

        var grid = {
          width: 2500,
          height: 2500
        }

        var Keys = {
          UP: 38,
          DOWN: 40,
          LEFT: 37,
          RIGHT: 39
        }

        var scroll = {
          x: 0,
          y: 0
        }

        var canvas = document.getElementById('myCanvas');
        var c = canvas.getContext('2d');

        window.addEventListener('keydown', handleKeyDown, false);

        initializeGrid();
        draw();

        function handleKeyDown(e) {
          switch (e.keyCode) {
            case Keys.UP:
              scroll.y -= ((scroll.y - tile.height) >= 0) ? tile.height : 0;
              break;
            case Keys.DOWN:
              scroll.y += tile.height;
              break;
            case Keys.LEFT:
              scroll.x -= ((scroll.x - tile.width) >= 0) ? tile.width : 0;
              break;
            case Keys.RIGHT:
              scroll.x += tile.width;
              break;
          }

          document.getElementById('scrollx').innerHTML = scroll.x;
          document.getElementById('scrolly').innerHTML = scroll.y;
        }

        function initializeGrid() {
          for (var i = 0; i < grid.width; i++) {
            tileMap[i] = [];
            for (var j = 0; j < grid.height; j++) {
              if ((i % 2) == 0 && (j % 2) == 0) {
                tileMap[i][j] = 0;
              } else {
                tileMap[i][j] = 1;
              }
            }
          }
        }

        function draw() {
          c.fillStyle = '#FFFFFF';
          c.fillRect (0, 0, canvas.width, canvas.height);
          c.fillStyle = '#000000';

          var startRow = Math.floor(scroll.x / tile.width);
          var startCol = Math.floor(scroll.y / tile.height);
          var rowCount = startRow + Math.floor(canvas.width / tile.width) + 1;
          var colCount = startCol + Math.floor(canvas.height / tile.height) + 1;

          for (var row = startRow; row < rowCount; row++) {
            for (var col = startCol; col < colCount; col++) {
              var tilePositionX = tile.width * row;
              var tilePositionY = tile.height * col;

              tilePositionX -= scroll.x;
              tilePositionY -= scroll.y;

              if (tileMap[row][col] == 0) {
                c.strokeRect(tilePositionX, tilePositionY, tile.width, tile.height);
              } else {
                c.fillRect(tilePositionX, tilePositionY, tile.width, tile.height);
              }
            }
          }

          setTimeout(draw, 1);
        }
      }
    </script>
  </head>
  <body>
    <canvas id="myCanvas" width="300" height="300"></canvas>
    <br />
    Use the UP, DOWN, LEFT and RIGHT keys to scroll
    <br />
    Scroll X: <span id="scrollx">0</span><br />
    Scroll Y: <span id="scrolly">0</span>
  </body>
</html>
Although, as Figure 1-9
shows, the difference in performance is extreme,
there is one more thing that we can optimize. In the previous example,
the initializeGrid() function took
care of filling the tileMap matrix
with zeros or ones, and storing the 6,250,000 elements in memory. Then,
inside the draw() loop, we show an
empty square if the positions X and Y of the matrix are even and a solid
square if they are uneven. We can accomplish the same without
using a matrix at all by modifying this bit of the draw() function:
if (tileMap[row][col] == 0) {
  c.strokeRect(tilePositionX, tilePositionY, tile.width, tile.height);
} else {
  c.fillRect(tilePositionX, tilePositionY, tile.width, tile.height);
}


if ((row % 2) == 0 && (col % 2) == 0) {
  c.strokeRect(tilePositionX, tilePositionY, tile.width, tile.height);
} else {
  c.fillRect(tilePositionX, tilePositionY, tile.width, tile.height);
}
This small modification allows us to get rid of the grid
initialization function, but now our grid is not being imposed with any
limits that would allow us to scroll beyond the 2,500×2,500 tiles that
we originally planned to use. Although this bug (other developers might
call it a feature) could be considered useful for some people, if we
want to force the grid to not scroll beyond the 2,500×2,500 boundary, we
need to modify another bit of the draw() function. We need to change this part
of the code:
var startRow = Math.floor(scroll.x / tile.width);
var startCol = Math.floor(scroll.y / tile.height);
var rowCount = startRow + Math.floor(canvas.width / tile.width) + 1;
var colCount = startCol + Math.floor(canvas.height / tile.height) + 1;
and impose the boundary below, like this:
var startRow = Math.floor(scroll.x / tile.width);
var startCol = Math.floor(scroll.y / tile.height);
var rowCount = startRow + Math.floor(canvas.width / tile.width) + 1;
var colCount = startCol + Math.floor(canvas.height / tile.height) + 1;

rowCount = ((startRow + rowCount) > grid.width) ? grid.width : rowCount;
colCount = ((startCol + colCount) > grid.height) ? grid.height : colCount;
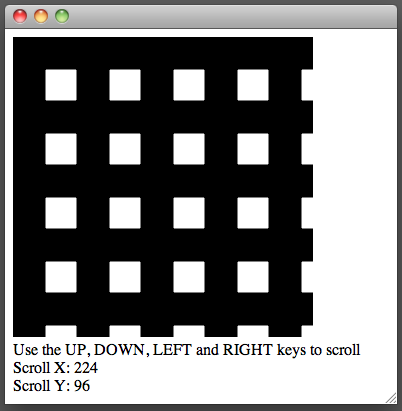
The entire code for this improved approach can be found on the official code repository as ex7-grid-canvas-alt.html. See the result in Figure 1-10.
Besides handling the scrolling, we’ll probably want to add other ways to interact with the grid, such as changing individual tiles when we click on them.
Translating the pixel coordinates returned by the click event to matrix coordinates in a square grid can be easily accomplished with the following formula:
var row = Math.floor(mousePositionX / tileWidth);
var column = Math.floor(mousePositionY / tileHeight);
If we need to take into account the scrolling coordinates, we just add them it to the mouse positions like this:
var row = Math.floor((mousePositionX + scrollPositionX) / tileWidth);
var column = Math.floor((mousePositionY + scrollPositionY) / tileHeight);
Having removed the grid initialization code raises an interesting question: how do we keep track of the elements that we have modified? Luckily for us, we don’t need to start arrays indexes on zero, which means that we can do this:
tileMap[2423] = [];
tileMap[2423][1803] = 4;
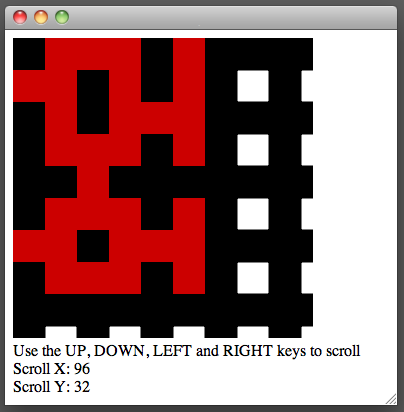
Using this approach, we’d store only the elements that we need. Other unset positions in the matrix would just return undefined or null. Example 1-7, ex8-grid-canvas.html in the code repository, shows how to implement this idea, with the result shown in Figure 1-11.
<!DOCTYPE html>
<html lang="en">
  <head>
    <meta charset="UTF-8" />
    <title>Example 8</title>

    <script>
      window.onload = function () {
        var tileMap = [];

        var tile = {
          width: 32,
          height: 32
        }

        var grid = {
          width: 2500,
          height: 2500
        }

        var Keys = {
          UP: 38,
          DOWN: 40,
          LEFT: 37,
          RIGHT: 39
        }

        var scroll = {
          x: 0,
          y: 0
        }

        var canvas = document.getElementById('myCanvas');
        var c = canvas.getContext('2d');

        canvas.addEventListener('click', handleClick, false);
        window.addEventListener('keydown', handleKeyDown, false);

        draw();

        function handleClick(e) {
          // When a click is detected, translate the mouse
          // coordinates to pixel coordinates
          var row = Math.floor((e.clientX + scroll.x) / tile.width);
          var column = Math.floor((e.clientY + scroll.y) / tile.height);

          if (tileMap[row] == null) {
            tileMap[row] = [];
          }
          tileMap[row][column] = 1;
        }

        function handleKeyDown(e) {
          switch (e.keyCode) {
            case Keys.UP:
              scroll.y -= ((scroll.y - tile.height) >= 0) ? tile.height : 0;
              break;
            case Keys.DOWN:
              scroll.y += tile.height;
              break;
            case Keys.LEFT:
              scroll.x -= ((scroll.x - tile.width) >= 0) ? tile.width : 0;
              break;
            case Keys.RIGHT:
              scroll.x += tile.width;
              break;
          }

          document.getElementById('scrollx').innerHTML = scroll.x;
          document.getElementById('scrolly').innerHTML = scroll.y;
        }

        function draw() {

          c.fillStyle = '#FFFFFF';
          c.fillRect (0, 0, canvas.width, canvas.height);
          c.fillStyle = '#000000';

          var startRow = Math.floor(scroll.x / tile.width);
          var startCol = Math.floor(scroll.y / tile.height);
          var rowCount = startRow + Math.floor(canvas.width / tile.width) + 1;
          var colCount = startCol + Math.floor(canvas.height / tile.height) + 1;

          rowCount = ((startRow + rowCount) > grid.width) ? grid.width : rowCount;
          colCount = ((startCol + colCount) > grid.height) ? grid.height : colCount;

          for (var row = startRow; row < rowCount; row++) {
            for (var col = startCol; col < colCount; col++) {
              var tilePositionX = tile.width * row;
              var tilePositionY = tile.height * col;

              tilePositionX -= scroll.x;
              tilePositionY -= scroll.y;

              if (tileMap[row] != null && tileMap[row][col] != null) {
                c.fillStyle = '#CC0000';
                c.fillRect(tilePositionX, tilePositionY, tile.width, tile.height);
                c.fillStyle = '#000000';
              } else {
                if ((row % 2) == 0 && (col % 2) == 0) {
                  c.strokeRect(tilePositionX, tilePositionY, tile.width, tile.height);
                } else {
                  c.fillRect(tilePositionX, tilePositionY, tile.width, tile.height);
                }
              }
            }
          }

          setTimeout(draw, 1);
        }
      }
    </script>
  </head>
  <body>
    <canvas id="myCanvas" width="300" height="300"></canvas>
    <br />
    Use the UP, DOWN, LEFT and RIGHT keys to scroll
    <br />
    Scroll X: <span id="scrollx">0</span><br />
    Scroll Y: <span id="scrolly">0</span>
  </body>
</html>
So far, all the optimizations that we have made allowed us to increase the performance of our game dramatically, but there is one more thing that we need to take care of before we go on.
The draw() loop—the heart and
soul of our game, which allows us to display elements on the screen—gets
called many times per second, regardless of whether the graphics inside
the canvas have changed. On other, more dynamic genres of video games in
which we’d find several objects moving on the screen at the same time,
this approach would be okay, but in the case of isometric real-time
strategy games, most graphics on the screen are usually static, so doing
this is a bit unnecessary; we can probably avoid it by calling draw() only as needed, instead of calling it
many times per second as we are currently doing.
However, also remember that the draw() function will render the entire grid
after the slightest change, so even calling draw() on demand could have a huge performance
penalty (see Figure 1-12), especially if we
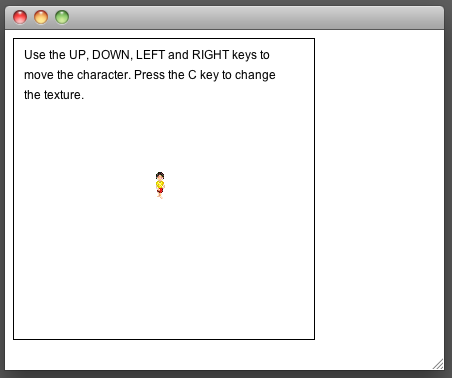
need to animate only a few small objects and leave the rest unchanged.
Back in the early 1990s, while at id Software, John Carmack was working on a game called Commander Keen, the very first side-scroller game released for the PC, when he was faced with a similar problem. To solve it, he invented a technique known as Adaptive Tile Refresh (ATR), in which he redrew only the area that had changed.
In order to implement a similar technique, we need to get rid of
the setTimeout() in the draw() loop and add four parameters to the
draw() function: srcX, srcY,
destX, and destY. Calling the draw() function without passing any parameters
should redraw the entire canvas; passing the srcX/Y and
destX/Y parameters should redraw only the area
within that boundary.
Example 1-8 shows how to do this.
<!DOCTYPE html>
<html lang="en">
<head>
<meta charset="UTF-8" />
<title>Example 9 - Grid modified to work with ATR (Adaptive Tile Refresh)</title>
<script src="timer.js" charset="utf-8"></script>
<script src="sprite.js" charset="utf-8"></script>
<script>
window.onload = function () {
var tile = {
width: 3,
height: 3
}
var grid = {
width: 100,
height: 100
}
var canvas = document.getElementById('myCanvas');
var c = canvas.getContext('2d');
var man1 = new Sprite('../img/char1.png', 32, 32, 0, 96, 4, 200);
var man2 = new Sprite('../img/char2.png', 32, 32, 0, 224, 6, 400);
var man3 = new Sprite('../img/char3.png', 32, 32, 0, 128, 4, 600);
var timer = new Timer();
// Draw the entire grid
draw();
displayAnimatedSprites();
function displayAnimatedSprites() {
timer.update();
man1.setPosition(120, 60);
man2.setPosition(120, 102);
man3.setPosition(120, 141);
// Redraw just the area of the grid being changed
draw(man1.posX, man1.posY, man1.width, man1.height);
draw(man2.posX, man2.posY, man2.width, man2.height);
draw(man3.posX, man3.posY, man3.width, man3.height);
man1.animate(c, timer);
man2.animate(c, timer);
man3.animate(c, timer);
setTimeout(function() {
displayAnimatedSprites(timer.getSeconds());
}, 100);
}
function draw(srcX, srcY, destX, destY) {
srcX = (srcX === undefined) ? 0 : srcX;
srcY = (srcY === undefined) ? 0 : srcY;
destX = (destX === undefined) ? canvas.width : destX;
destY = (destY === undefined) ? canvas.height : destY;
c.fillStyle = '#FFFFFF';
c.fillRect (srcX, srcY, destX + 1, destY + 1);
c.fillStyle = '#000000';
var startRow = 0;
var startCol = 0;
var rowCount = startRow + Math.floor(canvas.width / tile.width) + 1;
var colCount = startCol + Math.floor(canvas.height / tile.height) + 1;
rowCount = ((startRow + rowCount) > grid.width) ? grid.width : rowCount;
colCount = ((startCol + colCount) > grid.height) ? grid.height : colCount;
for (var row = startRow; row < rowCount; row++) {
for (var col = startCol; col < colCount; col++) {
var tilePositionX = tile.width * row;
var tilePositionY = tile.height * col;
if (tilePositionX >= srcX && tilePositionY >= srcY &&
tilePositionX <= (srcX + destX) &&
tilePositionY <= (srcY + destY)) {
c.strokeStyle = '#CCCCCC';
c.strokeRect(tilePositionX, tilePositionY, tile.width, tile.height);
}
}
}
}
}
</script>
</head>
<body>
<canvas id="myCanvas" width="300" height="300"></canvas>
</body>
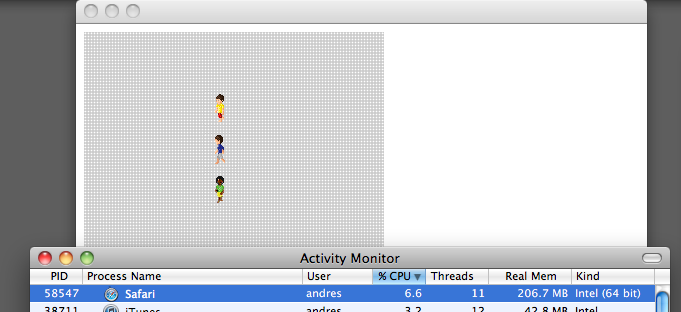
</html>Figure 1-13 shows that even while running three different animations simultaneously, the CPU usage has gone down dramatically from ~30% to just ~6.5%.
For the sake of simplicity, in this book we allow only one ATR
coordinate at a time, but on professional, more complex video games,
draw() functions may accept an array
with several ATR coordinates, which allows them to refresh many
positions with a single call. For example:
function  draw(atrArray) {
    for (var i = 0, len = atrArray.length; i < len; i++) {
          if (insideScreen(atrArray[i])) {
               drawGraphic();
          }
    }
}
Get Making Isometric Social Real-Time Games with HTML5, CSS3, and JavaScript now with the O’Reilly learning platform.
O’Reilly members experience books, live events, courses curated by job role, and more from O’Reilly and nearly 200 top publishers.

