7.3 K-NEAREST NEIGHBORS
7.3.1 Overview
The k-Nearest Neighbors (kNN) method provides a simple approach to calculating predictions for unknown observations. It calculates a prediction by looking at similar observations and uses some function of their response values to make the prediction, such as an average. Like all prediction methods, it starts with a training set but instead of producing a mathematical model it determines the optimal number of similar observations to use in making the prediction.

Figure 7.15. Nonlinear scenarios

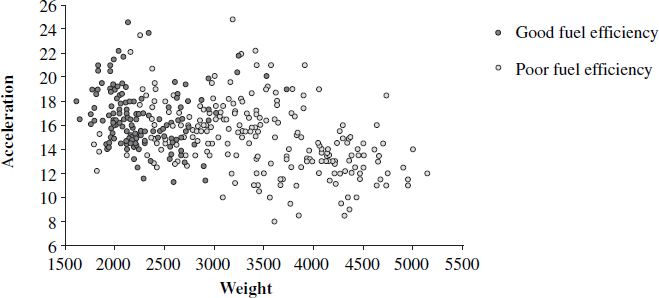
Figure 7.16. Scatterplot showing fuel efficiency classifications
The scatterplot in Figure 7.16 is based on a data set of cars and will be used to illustrate how kNN operates. Two variables that will be used as descriptors are plotted on the x- and y-axis (Weight and Acceleration). The response variable is a dichotomous variable (Fuel Efficiency) that has two values: good and poor fuel efficiency. The darker shaded observations have good fuel efficiency and the lighter shaded observations have poor fuel efficiency.
During the learning phase, the best number of similar observations is chosen (k). The selection of k is described in the next section. Once a value for k has been determined, it is now possible to make a prediction for a car with unknown fuel ...
Get Making Sense of Data: A Practical Guide to Exploratory Data Analysis and Data Mining now with the O’Reilly learning platform.
O’Reilly members experience books, live events, courses curated by job role, and more from O’Reilly and nearly 200 top publishers.

