7.8 EXERCISES
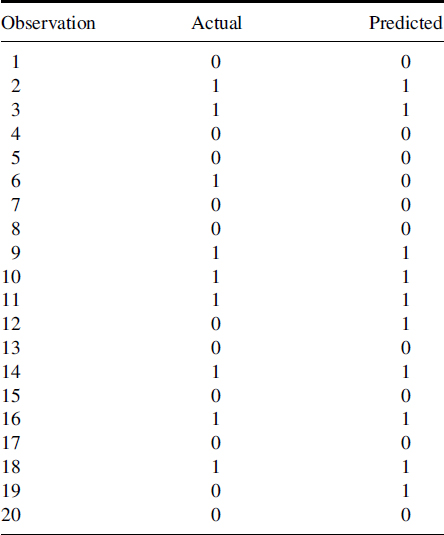
- A classification prediction model was built using a training set of examples. A separate test set of 20 examples is used to test the model. Table 7.21 shows the results of applying this test set. Calculate the model's:
- Concordance
- Error rate
- Sensitivity
- Specificity
Table 7.21. Table of actual vs predicted values (categorical response)
- A regression prediction model was built using a training set of examples. A separate test set was applied to the model and the results are shown in Table 7.22.
- Determine the quality of the model using r2
- Calculate the residual for each observation
- Table 7.23 shows the relationship between the amount of fertilizer used and the height of a plant.
- Calculate a simple linear regression equation using Fertilizer as the descriptor and Height as the response.
- Predict the height when fertilizer is 12.3
- A kNN model is being used to predict house prices. A training set was used to generate a kNN model and k is determined to be 5. The unseen observation in Table 7.24 is presented to the model. The kNN model determines the five observations in Table 7.25 from the training set to be the most similar. What would be the predicted house price value?
- A classification tree model is being used to predict which brand of printer a customer would purchase with a computer. The tree in Figure 7.36 was built from a training set of examples. For a customer ...
Get Making Sense of Data: A Practical Guide to Exploratory Data Analysis and Data Mining now with the O’Reilly learning platform.
O’Reilly members experience books, live events, courses curated by job role, and more from O’Reilly and nearly 200 top publishers.

