The standard Perl distribution comes with a debugger, although it’s really
just another Perl program, perl5db.pl. Since it is just a
program, I can use it as the basis for writing my own debuggers to suit my
needs, or I can use the interface perl5db.pl provides to configure its actions. That’s just the beginning,
though. I can write my own debugger or use one of the many debuggers created
by other Perl masters.
Before I get started, I’m almost required to remind you that Perl
offers two huge debugging aids: strict and warnings.
I have the most trouble with smaller programs for which I don’t think I
need strict and then I make the stupid mistakes it
would have caught. I spend much more time than I should have tracking down
something Perl would have shown me instantly. Common mistakes seem to be
the hardest for me to debug. Learn from the master: don’t discount
strict or warnings for even small programs.
Now that I’ve said that, you’re going to look for it in the examples
in this chapter. Just pretend those lines are there, and the book costs a
bit less for the extra half a page that I saved by omitting those lines.
Or if you don’t like that, just imagine that I’m running every program
with both strict and warnings turned
on from the command line:
$ perl -Mstrict -Mwarnings program
Along with that, I have another problem that bites me much more than I should be willing to admit. Am I editing the file on the same machine I’m running it on? I have login accounts on several machines, and my favorite terminal program has tabs so I can have many sessions in one window. It’s easy to checkout source from a repository and work just about anywhere. All of these nifty features conspire to get me into a situation where I’m editing a file in one window and trying to run it in another, thinking I’m on the same machine. If I’m making changes but nothing is changing in the output or behavior, it takes me longer than you’d think to figure out that the file I’m running is not the same one I’m editing. It’s stupid, but it happens. Discount nothing while debugging!
That’s a bit of a funny story, but I included it to illustrate a point: when it comes to debugging, Humility is one of the principal virtues of a maintenance programmer.[11]My best bet in debugging is to think that I’m the problem. That way, I don’t rule out anything or try to blame the problem on something else, like I often see in various Perl forums under titles such as “Possible bug in Perl.” When I suspect myself first, I’m usually right. Appendix B is my guide to solving any problem, which people have found useful for at least figuring out what might be wrong even if they can’t fix it.
No matter how many different debugger applications or integrated
development environments I use, I still find that plain ol’ print is my best debugger. I could load source into a debugger, set
some inputs and breakpoints, and watch what happens, but often I can
insert a couple of print statements and
simply run the program normally.[12]I put braces around the variable so I can see any leading or
trailing whitespace:
print "The value of var before is [$var]\n";

#... operations affecting $var;

print "The value of var after is [$var]\n";
I don’t really have to use print
because I can do the same thing with warn, which sends
its output to standard error:
warn "The value of var before is [$var]";

#... operations affecting $var;

warn "The value of var after is [$var]";
Since I’ve left off the newline at the end of my warn message, it gives me the filename and line
number of the warn:
The value of var before is [$var] at program.pl line 123.
If I have a complex data structure, I use
Data::Dumper to show it. It handles hash and array
references just fine, so I use a different character, the angle brackets
in this case, to offset the output that comes from
Data::Dumper:
use Data::Dumper qw(Dumper);
warn "The value of the hash is <\n" . Dumper( \%hash ) . "\n>\n";
Those warn statements showed the
line number of the warn statement.
That’s not very useful; I already know where the warn is since I put it there! I really want to
know where I called that bit of code when it became a problem. Consider a
divide subroutine that returns the
quotient of two numbers. For some reason, something in the code calls it
in such a way that it tries to divide by zero:[13]
sub divide
        {
        my( $numerator, $denominator ) = @_;

        return $numerator / $denominator;
        }
I know exactly where in the code it blows up because Perl tells me:
Illegal division by zero at program.pl line 123.
I might put some debugging code in my subroutine. With warn, I can inspect the arguments:
sub divide
        {
        my( $numerator, $denominator ) = @_;
        warn "N: [$numerator] D: [$denominator]";

        return $numerator / $denominator;
        }
I might divide in many, many
places in the code, so what I really need to know is which call is the
problem. That warn doesn’t do anything
more useful than show me the arguments.
Although I’ve called print the
best debugger in the world, I actually use a disguised form in
the carp function from the
Carp module, part of the standard Perl distribution.
It’s like warn, but it reports the
filename and line number from the bit of code that called the
subroutine:
#!/usr/bin/perl
use Carp qw(carp);

printf "%.2f\n", divide( 3, 4 );
printf "%.2f\n", divide( 1, 0 );
printf "%.2f\n", divide( 5, 4 );

sub divide
        {
        my( $numerator, $denominator ) = @_;
        carp "N: [$numerator] D: [$denominator]";

        return $numerator / $denominator;
        }
The output changes to something much more useful. Not only do I get
my error message, but carp adds some
information about the line of code that called it, and it shows me the
argument list for the subroutine. I see that the call from line 4 is fine,
but the call on line 5 is the last one before Perl kills the
program:
$ perl show-args.pl
N: [3] D: [4] at show-args.pl line 11
                main::divide(3, 4) called at show-args.pl line 4
0.75
N: [1] D: [0] at show-args.pl line 11
                main::divide(1, 0) called at show-args.pl line 5
Illegal division by zero at show-args.pl line 13.
The carp function is the
better-informed version of warn. If I
want to do the same thing with die, I
use the croak function. It gives the
same message as carp, but just
like die, croak stops the program.
I can change the warn and
die functions myself by messing with
%SIG. I like to use these to peer
into code I’m trying to figure out, but I don’t use these to add
features to code. It’s just part of my debugging toolbox.
The pseudokeys __WARN__ and
__DIE__ hold the functions that perform those actions when I use the
warn or die functions. I can use a reference to a
named subroutine or an anonymous subroutine:
$SIG{__DIE__} = \&my_die_handler;
$SIG{__DIE__} = sub { print "I'm about to die!" )
Without going through the entire code base, I can change all of
the die calls into the more
informative croak calls.[14]In this example, I preface the subroutine call with an
& and no parentheses to trigger
Perl’s feature to pass on the current argument list to the next
subroutine call so croak gets all of
the arguments I pass:
use Carp;
$SIG{__DIE__} = sub { &Carp::croak };

die "I'm going now!";  # really calls croak now
If I only want to do this for part of the code, I can use local (since %SIG is a special variable always in main::). My redefinition stays in effect until
the end of the scope:
local $SIG{__DIE__} = sub { &Carp::croak };After either of my customized routines runs, the functions do what
they would otherwise do; warn lets
the program continue, and die
continues its exception processing and eventually stops the
program.[15]
Since croak reports each level
of the call stack and I called it from an anonymous subroutine, I get an
artifact in my output:
use Carp;

print "Starting program...\n";

$SIG{__DIE__} = sub {
        local $Carp::CarpLevel = 0;

        &Carp::croak;
        };


foo(); # program dies here

sub foo { bar() }

sub bar { die "Dying from bar!\n"; }
In the stack trace, I see a subroutine call from __ANON__
followed by the subroutine calls I expect to bar() and foo():
Starting program...
Dying from bar!
 at die.pl line 12
                main::__ANON__('Dying from bar!\x{a}') called at die.pl line 20
                main::bar() called at die.pl line 18
                main::foo() called at die.pl line 16
I change my anonymous subroutine to adjust the position in the
stack where croak starts its report.
I set the value of $Carp::CarpLevel
to the number of levels I want to skip, in this case just 1:
$SIG{__DIE__} = sub {
        local $Carp::CarpLevel = 1;

        &Carp::croak;
        };
Now I don’t see the unwanted output:
Starting program...
Dying from bar!
 at die.pl line 12
                main::bar() called at die.pl line 18
                main::foo() called at die.pl line 16
For a real-life example of this in action, check out the CGI::Carp module. Lincoln Stein uses
the %SIG tricks to redefine warn and die in a web-friendly way. Instead of an
annoying “Server Error 500” message, I can get useful error output by
simply loading the module. While loading, CGI::Carp
sets $SIG{__WARN__} and $SIG{__DIE__}:
use CGI::Carp qw(fatalsToBrowser);
The fatalsToBrowser
function takes over the resulting page to show me the error, but
the module has other interesting functions such as set_message, which can catch compile-time
errors and warningsToBrowser, which
makes the warnings in HTML comments embedded in the output.
Of course, I don’t recommend that you use this in production code. I don’t want users to see the program’s errors. They can be handy when I have to debug a program on a remote server, but once I figure out the problem, I don’t need it anymore. By leaving it in there I let the public figure out how I’m doing things, and that’s bad for security.
The Carp module also provides the cluck
and confess subroutines to dump stack
traces. cluck is akin to warn (or carp) in that it prints its message but lets
the program continue. confess does
the same thing, but like die, stops
the program once it prints its mess.[16]
Both cluck and confess print stack traces, which show the list of subroutine calls and
their arguments. Each subroutine call puts a frame
with all of its information onto the stack. When the subroutine
finishes, Perl removes the frame for that subroutine, and then Perl
looks on the stack for the next frame to process. Alternately, if a
subroutine calls another subroutine, that puts another frame on the
stack.
Here’s a short program that has a chain of subroutine calls. I
call the do_it function, which calls
multiply_and_divide, which in turn
calls the divide. Now, in this
situation, I’m not getting the right answer for dividing 4 by 5. In
this short example, you can probably spot the error right away, but
imagine this is a huge mess of arguments, subroutine calls, and other
madness:
#!/usr/bin/perl
use warnings;
use Carp qw(cluck);

print join " ", do_it( 4, 5 ), "\n";

sub do_it
        {
        my( $n, $m ) = @_;

        my $sum = $n + $m;
        my( $product, $quotient ) =
                multiply_and_divide( [ $n, $m ], 6, { cat => 'buster' } );

        return ( $sum, $product, $quotient );
        }

sub multiply_and_divide
        {
        my( $n, $m ) = @{$_[0]};

        my $product = $n * $m;
        my $quotient = divide( $n, $n );

        return ( $product, $quotient );
        }

sub divide
        {
        my( $n, $m ) = @_;
        my $quotient = $n / $m;
        }
I suspect that something is not right in the divide subroutine, but I also know that it’s
at the end of a chain of subroutine calls. I want to examine the path
that got me to divide, so I want a
stack trace. I modify divide to use
cluck, the warn version of Carp’s
stack tracing, and I put a line of hyphens before and after the cluck() to set apart its output to make it
easier to read:
sub divide
        {
        print "-" x 73, "\n";
        cluck();
        print "-" x 73, "\n";

        my( $n, $m ) = @_;

        my $quotient = $n / $m;

        }
The output shows me the list of subroutine calls, with the most
recent subroutine call first (so, the list shows the stack order). The
stack trace shows me the package name, subroutine name, and the
arguments. Looking at the arguments to divide, I see a repeated 4. One of those arguments should be 5. It’s not divide’s fault after all:
-------------------------------------------------------------------------
 at confess.pl line 68
-------------------------------------------------------------------------
                main::divide(4, 4) called at confess.pl line 60
                main::multiply_and_divide('ARRAY(0x180064c)') called at confess.pl line 49
                main::do_it(4, 5) called at confess.pl line 41
9 20 1
It’s not a problem with divide,
but with the information I sent to it. That’s from multiply_and_divide, and looking at its call
to divide I see that I passed the
same argument twice. If I’d been wearing my glasses, I might have been
able to notice that $n might look
like $m, but really isn’t:
my $quotient = divide( $n, $n );  # WRONG

my $quotient = divide( $n, $m );  # SHOULD BE LIKE THIS
This was a simple example, and still Carp had
some problems with it. In the argument list for multiply_and_divide, I just get 'ARRAY(0x180064c)'. That’s not very helpful.
Luckily for me, I know how to customize modules (Chapters 9 and 10), and by looking at
Carp, I find that the argument formatter is in
Carp::Heavy. The relevant part of the subroutine has
a branch for dealing with references:
package Carp;
# This is in Carp/Heavy.pm

sub format_arg {
  my $arg = shift;

        ...

  elsif (ref($arg)) {
          $arg = defined($overload::VERSION) ? overload::StrVal($arg) : "$arg";
  }
        ...

  return $arg;
}
If format_arg sees a reference,
it checks for the overload module, which lets me
define my own actions for Perl operations, including stringification. If
Carp sees that I’ve somehow loaded
overload, it tries to use the overload::StrVal subroutine to turn the
reference into something I can read. If I haven’t loaded
overload, it simply interpolates the reference in
double quotes, yielding something like the ARRAY(0x180064c) I saw before.
The format_arg function is a
bit simple-minded, though. I might have used the
overload module in one package, but that doesn’t mean
I used it in another. Simply checking that I’ve used it once somewhere
in the program doesn’t mean it applies to every reference. Additionally,
I might not have even used it to stringify references. Lastly, I can’t
really retroactively use overload for
all the objects and references in a long stack trace, especially when I
didn’t create most of those modules. I need a better way.
I can override Carp’s format_arg to do what I need. I copy the
existing code into a BEGIN block so I
can bend it to my will. First, I load its original source file,
Carp::Heavy, so I get the original definition loaded
first. I replace the subroutine definition by assigning to its typeglob.
If the subroutine argument is a reference, I pull in
Data::Dumper, set some Dumper parameters to fiddle with the output
format, then get its stringified version of the argument:
BEGIN {
use Carp::Heavy;

no warnings 'redefine';
*Carp::format_arg = sub {
        package Carp;
        my $arg = shift;

        if( not defined $arg )
                { $arg = 'undef' }
        elsif( ref $arg )
                {
                use Data::Dumper;
                local $Data::Dumper::Indent = 0; # salt to taste
                local $Data::Dumper::Terse  = 0;
                $arg = Dumper( $arg );
                $arg =~ s/^\$VAR\d+\s*=\s*//;
                $arg =~ s/;\s*$//;
                }
        else
                {
                $arg =~ s/'/\\'/g;
                $arg = str_len_trim($arg, $MaxArgLen);
                $arg = "'$arg'" unless $arg =~ /^-?[\d.]+\z/;
                }

        $arg =~ s/([[:cntrl:]]|[[:^ascii:]])/sprintf("\\x{%x}",ord($1))/eg;
        return $arg;
        };
}
I do a little bit of extra work on the Dumper output. It normally gives me something
I can use in eval, so it’s a Perl
expression with an assignment to a scalar and a trailing semicolon. I
use a couple of substitutions to get rid of these extras. I want to get
rid of the Data::Dumper artifacts on
the ends:
$VAR = ... ; # leave just the ...
Now, when I run the same program I had earlier, I get better
output. I can see in elements of the anonymous array that I passed to
multiply_and_divide:
-------------------------------------------------------------------------
 at confess.pl line 65
                main::divide(4, 4) called at confess.pl line 57
                main::multiply_and_divide([4,5]) called at confess.pl line 46
                main::do_it(4, 5) called at confess.pl line 38
9 20 1
The best part of all of this, of course, is that I only had to add
cluck in one subroutine to get all of
this information. I’ve used this for very complex situations with lots
of arguments and complex data structures, giving me a Perl-style stack
dump. It may be tricky to go through, but it’s almost painless to get
(and to disable, too).
In the previous section I changed &Carp::format_arg to do something
different. The general idea is very useful for debugging since I’m not
only going to find bugs in the code that I write, but most often in the
modules I use or in code that someone else wrote.
When I need to debug these things in other files, I want to add some debugging statements or change the code somehow to see what happens. However, I don’t want to change the original source files; whenever I do that I tend to make things worse no matter how careful I am to restore them to their original state. Whatever I do, I want to erase any damage I do and I don’t want it to affect anyone else.
I do something simple: copy the questionable module file to a new
location. I set up a special directory for the debugging section just to
ensure that my mangled versions of the modules won’t infect anything
else. Once I do that, I set the PERL5LIB environment variable so Perl finds my mangled version first. When I’m
done debugging, I can clear PERL5LIB
to use the original versions again.
For instance, I recently needed to check the inner workings of
Net::SMTP because I didn’t think it was handling the
socket code correctly. I choose a directory to hold my copies, in this
case ~/my_debug_lib, and set
PERL5LIB to that path. I then create
the directories I need to store the modified versions, then copy the
module into it:
$ export PERL5LIB=~/my_debug_lib
$ mkdir -p ~/my_debug_lib/Net/
$ cp `perldoc -l Net::SMTP` ~/my_debug_lib/Net/.
Now, I can edit ~/my_debug_lib/Net/SMTP.pm, run my code to
see what happens, and work toward a solution. None of this has affected
anyone else. I can do all the things I’ve already showed in this
chapter, including inserting confess
statements at the right places to get a quick dump of the call stack.
Every time I wanted to investigate a new module, I copied it into my
temporary debugging library directory.
I don’t have to copy a module file to change its behavior. I can
override parts of it directly in my code. Damian Conway wrote a wonderful module called
Hook::LexWrap to wrap a subroutine around another
subroutine. That means that my wrapper subroutine can see the arguments
coming in and the return values going out. I can inspect the values, or
even change them if I like.
I’ll start with my simple example program that adds a couple of
numbers. As before, it has some problems because I’m passing it the
wrong arguments since I can’t tell the difference between $n and $m,
and have used $n twice in my call to
add. Just running the program gives
me the wrong answer, but I don’t know where the problem is:
#!/usr/bin/perl

# @ARGV = qw( 5 6 );

my $n = shift @ARGV;
my $m = $ARGV[0];

print "The sum of $n and $m is " . add( $n, $n ) . "\n";

sub add
        {
        my( $n, $m ) = @_;

        my $sum = $n + $m;

        return $sum;
        }
I don’t want to change anything in the code, or, I should say, I want to look at what’s happening without affecting the statements that are already there. As before, I want everything back to normal when I’m finished debugging. Not editing the subroutine makes that easier.
The Hook::LexWrap gives me a chance to do
something right after I make a subroutine call and right before the
subroutine returns. As the name suggests, it wraps the subroutine with
another one to provide the magic. The Hook::LexWrap::wrap function takes the name of
the subroutine it will wrap, add in
this case, and then anonymous subroutines as pre- and
posthandlers:
#!/usr/bin/perl

use Hook::LexWrap qw(wrap);

my $n = shift @ARGV;
my $m = $ARGV[0];

wrap add,
        pre  => sub { print "I got the arguments: [@_]\n" },
        post => sub { print "The return value is going to be $_[-1]\n" }
        ;

# this line has the error
print "The sum of $n and $m is " . add( $n, $n ) . "\n";

sub add
        {
        my( $n, $m ) = @_;

        my $sum = $n + $m;

        return $sum;
        }
The prehandler sees the same argument list as my call to add. In this case I just output the list so I
can see what it is. The posthandler gets the same arguments, but
Hook::LexWrap adds another element, the return value,
on the end of @_. In the posthandler,
$_[-1] is always
the return value. My program now outputs some useful debugging output,
and I see that I’m passing the same argument twice:
$ perl add_numbers.pl 5 6
I got the arguments: [5 5 ]
The return value is going to be 10
The sum of 5 and 6 is 10
In that output, notice the space after the last 5. Since wrap added an element to @_, even though it’s undef, I get a space between it and the
preceding 5 when I interpolate the
array in the double-quoted string.
Hook::LexWrap has the magic to handle all the
calling contexts too. It’s smart enough to handle scalar, list, and void
contexts. In list context, that last element of @_ in the posthandler will be an array
reference. In void context, it won’t be anything.
It gets even better than that, though.
Hook::LexWrap actually adds that extra element to
@_ before it does anything. Look at
the last output carefully. After the second argument, there’s a space
between the second 5 and the closing
square bracket. That’s the space between 5 and the undef value of the extra element in @_.
In the prehandler, I can assign to that element, signaling to
Hook::LexWrap that it should assume that it already
has the return value, so it doesn’t need to actually run the original
subroutine. If the subroutine isn’t doing what I need, I can force it to
return the right value:
#!/usr/bin/perl

use Hook::LexWrap;

my $n = shift @ARGV;
my $m = $ARGV[0];

{

wrap add,
        pre  => sub {
                print "I got the arguments: [@_]\n";
                $_[-1] = "11";
                },
        post => sub { print "The return value is going to be $_[-1]\n" }
        ;
print "The sum of $n and $m is " . add( $n, $m ) . "\n";
}

sub add
        {
        my( $n, $m ) = @_;

        my $sum = $n + $m;

        return $sum;
        }
Now that I’ve assigned to $_[-1] in my prehandler, the output is
different. It doesn’t run the subroutine or the posthandler, and I get
back 11:
$ perl add_numbers.pl 5 6
I got the arguments: [5 6 ]
The sum of 5 and 6 is 11
With my fake return value, I can give myself the right answer and get on with the right program, and do it without changing the subroutine I want to investigate. This can be especially handy if I’m working on a big problem where other things are broken, too. I know what I need to return from the subroutine so I make it do that until I fix the other parts, or at least investigate the rest of the program while the subroutine returns what it should. Sometimes eliminating a source of error, even temporarily, makes it easier to fix other things.
We introduced the standard Perl debugger in Intermediate Perl so we could examine complex data structures. It’s well documented in the perldebug, and Richard Foley devoted an entire book, Pro Perl Debugging (Apress), to it, so I will only cover enough of the basics here so I can move on to the fancier debuggers.
I invoke the Perl debugger with Perl’s -d switch:
perl -d add_number.pl 5 6
Perl compiles the program, but stops before running the statements, giving me a prompt. The debugger shows me the program name, line number, and the next statement it will execute:
Loading DB routines from perl5db.pl version 1.25
Editor support available.

Enter h or `h h' for help, or `man perldebug' for more help.

main::(Scripts/debugging/add_numbers.pl:3):
3:      my $n = shift @ARGV;
  D<1>
From there I can do the usual debugging things, such as single-stepping through code, setting breakpoints, and examining the program state.
I can also run the debugger on a program I specify on the command
line with the -e. I still get the
debugger prompt, but it’s not very useful for debugging a program.
Instead, I have access to the debugger prompt where I can try Perl
statements:
$ perl -d -e 0

Loading DB routines from perl5db.pl version 1.25
Editor support available.

Enter h or `h h' for help, or `man perldebug' for more help.

main::(-e:1):   0
  D<1> $n = 1 + 2;

  D<2> x $n
0  3
  D<3>
We showed this debugger in Intermediate Perl, and it’s well documented in perldebug and many other tutorials, so I won’t spend time on it here. Check the references in the last section in this chapter, Further Reading,” for sources of more information.
Besides the standard perl5db.pl, there are several other sorts of debuggers that I can use,
and there are several code analysis tools which use the debugging
infrastructure. There’s a long list of Devel:: modules
on CPAN, and one of them probably suits your needs.
I can use an alternative debugger by giving the -d switch an argument. In this case, I want to run my program under
the Devel::DProf module. The -d switch implies the Devel::, so I leave that off. I’ll cover
profilers in depth in Chapter 5.
$ perl -d:DProf program.pl
If I write my own debugging module, I can pass arguments to the
module just like I can with the -M switch. I add
the arguments as a comma-separated list after the module name and an
equal sign. In this example, I load the
Devel::MyDebugger with the arguments foo and
bar:
$ perl -d:MyDebugger=foo,bar
As normal Perl code, this is the same as loading
Devel::MyDebugger with use.
use Devel::MyDebugger qw( foo bar );
I can use a Tk-based debugger that provides a graphical interface to the same
features I have from perl5db.pl. The
Devel::ptkdb module does not come with Perl, so I
have to install it myself.[17]I start ptkdb by
specifying it as the debugger I want to use with the -d switch:
$ perl -d:ptkdb program.pl
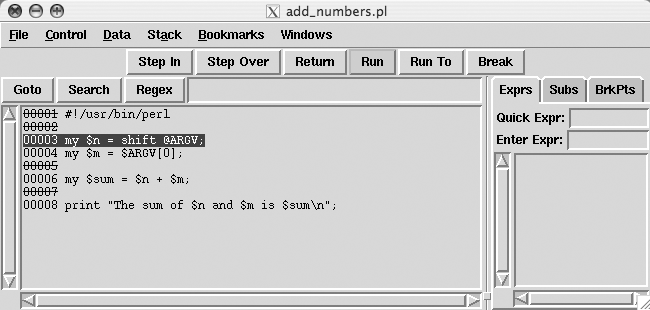
It starts by creating an application window. In the left pane, I see the program lines around the current line, along with their line numbers (Figure 4-1). Buttons along the code pane allow me to search through the code. In the right pane, I have tabs to examine expressions, subroutines, and the list of current breakpoints.
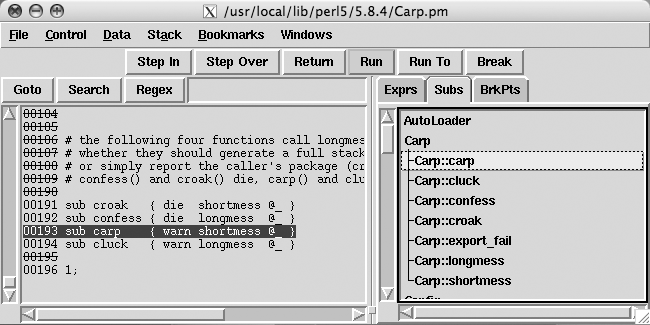
The “Subs” tab gives me a hierarchal list of package names and the
subroutines defined in them (Figure 4-2). These are
all of the loaded modules, and I can immediately display the code for
any of those functions by selecting the one I want to see. I can select
one either by double-clicking or navigating with the arrow keys and
hitting <RETURN> when I get to
the one I want. It doesn’t change the state of my program, and I can use
the “Subs” tab to decide to step into a subroutine to watch its
execution, or step over it and continue with the execution of the
program.
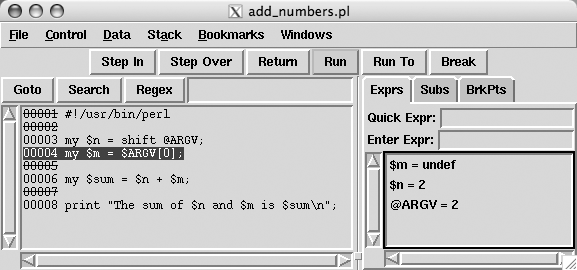
The “Exprs” tab is especially useful. It has two text entries at the top. “Quick Expr” allows me to enter a Perl expression, which it then replaces with its result, and affects the state of the program if my quick expression sets or changes variables. This is the equivalent of trying a one-off expression in the terminal debugger. That’s nice, but the “Enter Expr” is even better. I enter a Perl expression and it adds it to the list of expressions in the pane below the tabs (Figure 4-3). As I run my code, these expressions update their results based on the current state of the program. I can add the variables I want to track, for instance, and watch their values update.
I start with a simple program where I want to add two numbers.
It’s not something that I need to debug (I hope), but I can use it to
show the expressions tab doing its thing. At the start of the program,
I’m at the start of the program and nothing has run yet. I single-step
over the first line of code and can see the values for $m and $n,
which I had previously entered as expressions. I could enter much more
complex expressions, too, and ptkdb
will update them as I move through the code.
The Devel::ebug module by Léon Brocard provides an object-oriented interface to
Perl’s debugger facility. It’s a work in progress, so what I say here
might be different by the time you read this. The main features should
still be there, though.
It comes with its own terminal-based debugger named ebug. It’s a bit of an odd name until you
realize how you call it. The missing d in the name comes from Perl’s -d switch.
$ perl -d:ebug program.pl
I don’t need to use the -d
switch, though, since I can call it directly with the
ebug program, but I have to call it by quoting the
entire command line:[18]
$ ebug "add_numbers.pl 5 6"
* Welcome to Devel::ebug 0.46
main(add_numbers.pl#3):
my $n = shift @ARGV;
ebug: x @ARGV
--- 5
--- 6

main(add_numbers.pl#3):
my $n = shift @ARGV;
ebug: s
main(add_numbers.pl#4):
my $m = $ARGV[0];
ebug: x $n
--- 5
The ebug program is really just a wrapper
around Devel::ebug::Console, and I can call
Devel::ebug in many different ways. At the core of
its design is a detached process. The backend runs the program under the
debugger, and the frontend communicates with it over TCP. This means,
for instance, I can debug the program on a different machine than on the
one it’s running.
The Devel::ebug::HTTP module uses the same
Devel::ebug backend, but sets up a mini web
server.[19]I start the ebug_http
the same way I did with the console version, but instead of giving me a
prompt, it tells me the URL I need to access to see the debugger:[20]
$ ebug_http "add_numbers.pl 4 5"
You can connect to your server at http://albook.local:8321
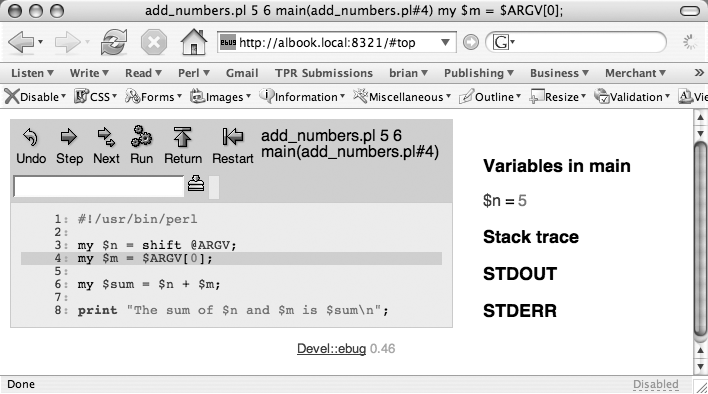
The web page shows me a bare bones debugger interface (Figure 4-4). Remember, this is basically a proof of concept, but even as that it’s very impressive and can serve as the basis for your own tailor-made programs.
Eclipse[21]is an open source development environment that runs on a variety of platforms. It’s a Java application, but don’t let that scare you off. It has a modular design so people can extend it to meet their needs. EPIC[22]is the Perl plug-in for Eclipse.
Eclipse is not just a debugger though, and that’s probably not even its most interesting features. From the source code of my Perl program I can inspect classes, call up parts of the Perl documentation, and do quite a bit more.
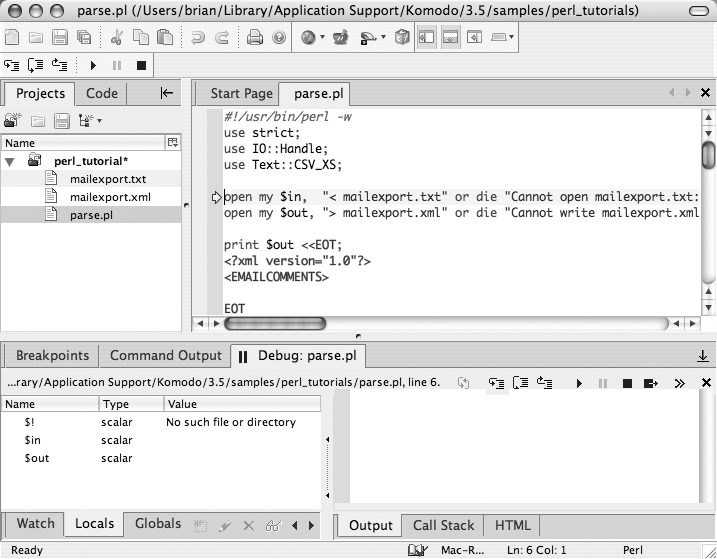
ActiveState’s Komodo (Figure 4-5) started off as an integrated development environment for Perl on Microsoft Windows, although it’s now available on Solaris, Linux, and Mac OS X. It handles Perl as well as several other languages, including Tcl, Ruby, PHP, and Python.
Affrus is a Perl-only debugger from Late Night Software[*]for Mac OS X. Since I work almost exclusively on Mac, I really appreciate a debugger that’s quite Mac-like. Late Night Software started with Script Debugger for AppleScript, so they’re tuned into Macs. Besides that, Affrus has the usual debugging features.
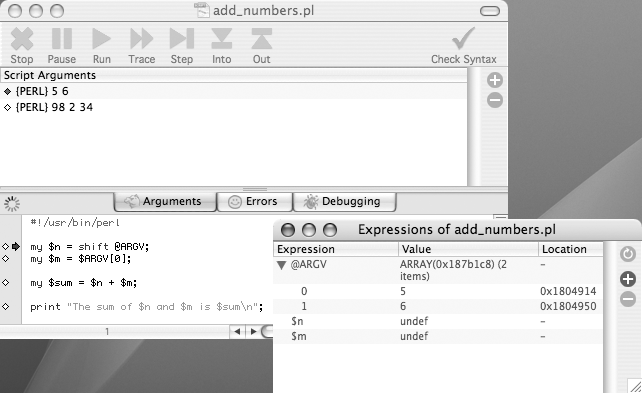
One of the features I find especially useful is Affrus’s Arguments
pane. I can add invocations of my program, and then select which one I
want to run. In Figure 4-6, I’ve added two different
command lines and selected the first one, which has the solid diamond
next to it. When I run the program, @ARGV gets the elements 5 and 6. If
I save this as an Affrus file, the next time I open the program with
Affrus I still have access to those command lines.
Figure 4-6. Affrus allows me to configure several different command lines to use with my program; it updates expressions as my program runs
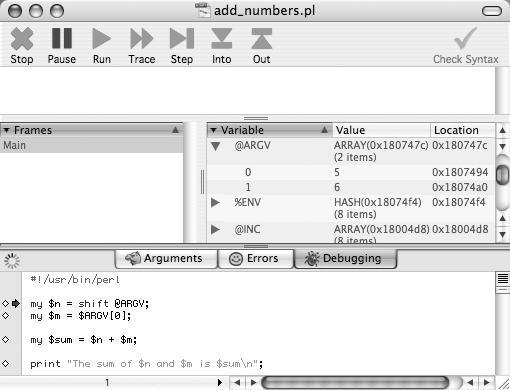
Like other debuggers, Affrus has a window where I can track the values of expressions. Affrus uses a separate window to display those. I can also look in the Debugging pane to see a list of all of the variables at any time (Figure 4-7).
I can debug my Perl program at almost any level I want, from inserting debugging code around that part I want to inspect, or tweaking it from the outside with an integrated development environment. I can even debug the program on a machine other than the one I run it on. I don’t have to stick with one approach, and might use many of them at the same time. If I’m not satisfied with the existing debuggers, I can even create my own and tailor it for my particular task.
Perl Debugged by Peter Scott and Ed Wright (Addison-Wesley) is one of the best books about actually programming with Perl. Not only do they show you how to effectively debug a Perl program, but they also show you how to not get yourself into some of the common traps that force you to debug a program. Sadly, this book appears to be out of print, but don’t let the $1.99 price for a used version on Amazon.com color your notion of its usefulness.
Pro Perl Debugging (Apress) by Richard Foley
tells you everything you need to know about the
perl5db.pl debugger, which comes with Perl. If you like
Perl’s default debugger, this book will tell you everything you want to
know about it.
My first ever piece of Perl writing was a little piece for The Perl Journal number 9 called “Die-ing on the Web.” It’s available at my personal web site: http://www.pair.com/comdog/Articles/Die_and_the_Web.txt.
I talk more about Hook::LexWrap in “Wrapping
Subroutines” in the July 2005 issue of The Perl
Journal. The article originally appeared in The Perl
Journal and now appears in the “Lightweight Languages” section
on Dr. Dobb’s Journal Online: http://www.ddj.com/dept/lightlang/184416218.
The Practice of Programming by Brian W. Kernighan and Rob Pike (Addison-Wesley) discusses their approach to debugging. Although this isn’t a Perl book, it really doesn’t need to be about any language. It’s practical advice for any sort of programming.
[11] Larry Wall says that Laziness, Impatience, and Hubris are the principal virtues of a programmer, but those only work if the programmer is creating the code. Everyone else in the software development life cycle needs Tact, Humility, and Low Blood Pressure.
[12] In Chapter 10, I show how I do this with
third-party modules, too: copy the source to a private directory I add
to the front of @INC. I can edit
that copy without worrying about breaking the original.
[13] I know I should wrap an eval
around this, but I need an example where things go wrong. Even if I
did wrap it in an eval, I still
need to find the culprit passing the unexpected input.
[14] It changes all of the calls, so if I’m using mod_perl I’ll end up changing it for every
program since they share the same global variables. Oops.
[15] My __DIE__ handler can
escape die’s further exception
processing by using exit or
another die, which won’t be
special inside my handler. See perlvar’s
discussion on %SIG for
details.
[16] And I really mean mess. These functions both call Carp::longmess, and once you see the
output, you’ll agree.
[17] This might mean that I have to install the
Tk module too. Once installed, I also have to be
able to display it in some sort of window manager. On my Powerbook,
I use Apple’s X11 program (which is really XFree86 to the rest of
the world). Windows users might want to use something such as
ReflectionX.
[18] The run method to
Devel::ebug::Console concatenates with an empty
string everything in @ARGV, so
calling this example without the quotes tries to run the program
named add_numbers.pl56 with no arguments.
[19] Once you get everything installed, but sure that you copy the
root/ directory from the
Devel::ebug::HTTP distribution to the same
directory as the Devel::ebug::HTTP modules. Find
that directory with perldoc -l
Devel::ebug::HTTP. The root/ directory has the files that
Catalyst needs to make the web pages.
[20] I can also guess the URL, since I know the name of the machine and can figure out which port it will use.
[21] The Eclipse Foundation (http://www.eclipse.org).
[22] Eclipse Perl Integration (http://e-p-i-c.sourceforge.net).
[*] Late Night Software (http://www.latenightsw.com).
Get Mastering Perl now with the O’Reilly learning platform.
O’Reilly members experience books, live events, courses curated by job role, and more from O’Reilly and nearly 200 top publishers.
