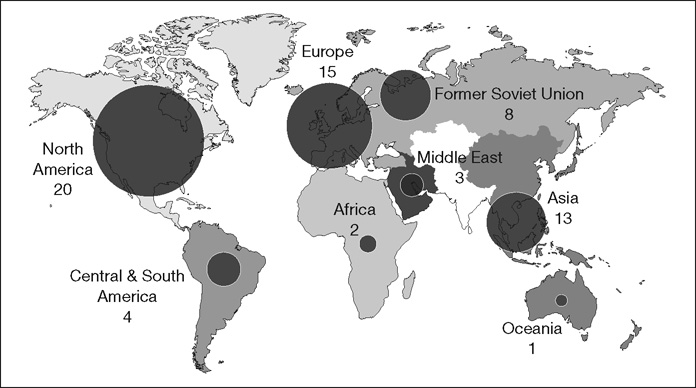
Crude Oil Consumption
Figure 3.5 shows the global crude oil consumption in 1990, with North America being the largest consumer (20 per cent) followed by Europe (15 per cent) and Asia (13 per cent).
Twenty years later the map has changed enormously, with Figure 3.6 showing the consumption data for 2010, illustrating the big hike in demand from Asia (mostly China) – up to 25 per cent. North American consumption is up slightly at 23 per cent and Europe’s consumption remains static at 15 per cent of the total.
Figure 3.6 Oil consumption – 2010
Source: EIA
Get Mastering the Commodities Markets now with the O’Reilly learning platform.
O’Reilly members experience books, live events, courses curated by job role, and more from O’Reilly and nearly 200 top publishers.

