MEAN REVERSION SYSTEMS USING 30-MINUTE BARS
The data displayed for the 30-minute bar time frame include history from February 14, 2000, to January 30, 2004.
RSI Extremes with 100-Hour Moving Average Filter
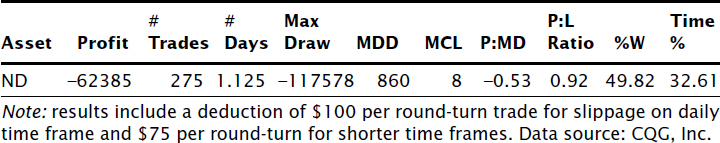
Table 5.10 shows that one of our most successful and robust trading systems up until this point has failed miserably in this shorter time frame. Whenever a trading system shifts so dramatically from profitability, we need to ask why.
TABLE 5.9 RSI crossover with 3% profit exit and 1% stop.
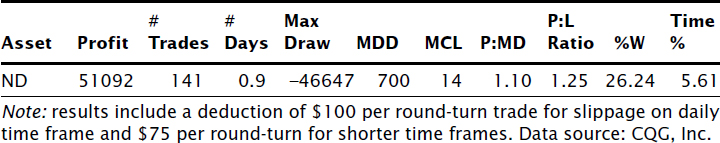
TABLE 5.10 RSI extremes with 100-hour moving average filter an 2.5% stop.
One possible answer could be that the fixed costs and smaller per-trade profits means that this system was destined to fail over shorter time frames. This deterioration as time frames are shortened was exemplified in our examination of IEURUSD with MACD in Table 5.1. These same factors may be the underlying cause of the failure occurring in Table 5.10; to determine if this is true, we must compare the conditions in Table 5.1 to those in Table 5.10.
A distinct difference between MACD and RSI extremes was that MACD's entry and exit conditions were all based on indicators (exponential moving averages) that automatically adapted to whatever time frame was being traded. By contrast, one of the exit conditions in RSI extremes ...
Get Mechanical Trading Systems: Pairing Trader Psychology with Technical Analysis now with the O’Reilly learning platform.
O’Reilly members experience books, live events, courses curated by job role, and more from O’Reilly and nearly 200 top publishers.

