Chapter 24Using 3D Maps
You can build a pivot table and display the results on an animated map using the 3D Map feature. This functionality debuted as the Power Map add-in for Excel 2013. The functionality was renamed 3D Map and built in to Excel starting with Excel 2016.
Examples of 3D Maps
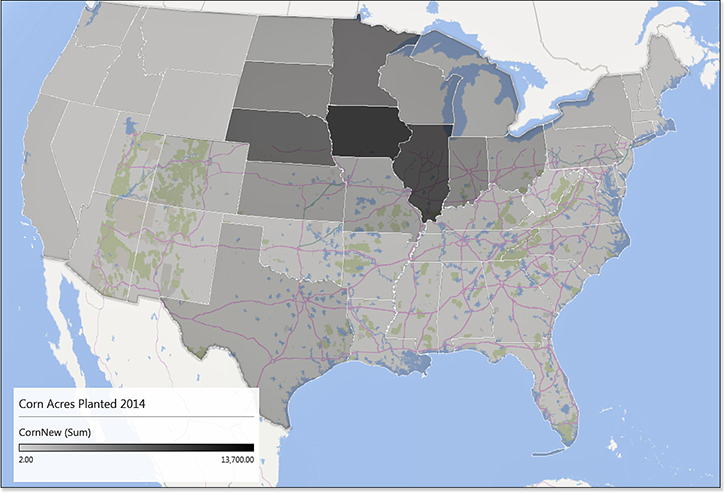
The first three figures represent corn acreage by state for the year 2014. Figure 24.1 shows a shaded area map. Iowa and Illinois are the leading producers of corn.
Get Microsoft Excel 2019 Inside Out now with the O’Reilly learning platform.
O’Reilly members experience books, live events, courses curated by job role, and more from O’Reilly and nearly 200 top publishers.

