Adding Trend Lines
A trend line is a line that describes the general tendency of a data series. It can be a moving average, a linear-regression line, or a line generated by one of various kinds of nonlinear curve-fitting methods.
To add a trend line to a series in an area, bar, column, line, or xy (scatter) chart, first select the series, and then choose Chart, Add Trendline. (This command appears only when a series is selected.) Excel displays the Add Trendline dialog box shown in Figure 26-12.
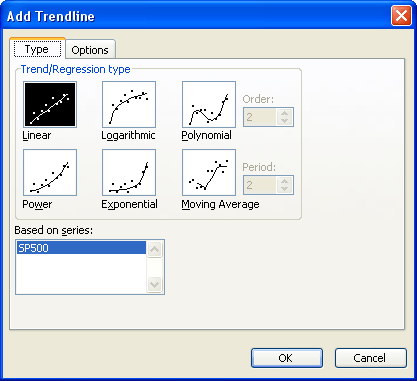
Figure 26-12. Using the Add Trendline dialog box, you can add six different types of trend lines to your data series.
To specify how Excel should draw the ...
Get Microsoft® Office Excel 2003 Inside Out now with the O’Reilly learning platform.
O’Reilly members experience books, live events, courses curated by job role, and more from O’Reilly and nearly 200 top publishers.

