Chapter 10. Creating Charts
Chapter 10 at a Glance
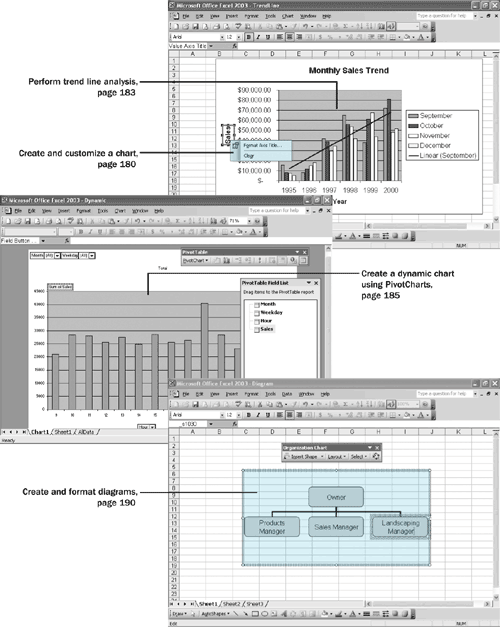
In this chapter you will learn to: |
✓ Create and customize a chart. |
✓ Perform trend line analysis. |
✓ Create a dynamic chart using PivotCharts. |
✓ Create diagrams to illustrate relationships and processes. |
When you enter data into a Microsoft Excel worksheet, you create a record of important events, whether they are individual sales, sales for an hour of a day, or the price of a product. What a list of values in cells can’t communicate easily, however, are the overall trends in the data. The best way to communicate trends in a large collection of data is through charts and graphs, which summarize data visually. ...
Get Microsoft® Office Excel® 2003 Step by Step now with the O’Reilly learning platform.
O’Reilly members experience books, live events, courses curated by job role, and more from O’Reilly and nearly 200 top publishers.

