Monitoring Locking and Blocking
SQL Server provides many different avenues for viewing and investigating locking problems. Locking may be investigated through sp_lock, sys.dm_tran_locks, SQL Profiler, PerfMon, and Extended Events, just to name a few.
Viewing Blocking with Management Studio Reports
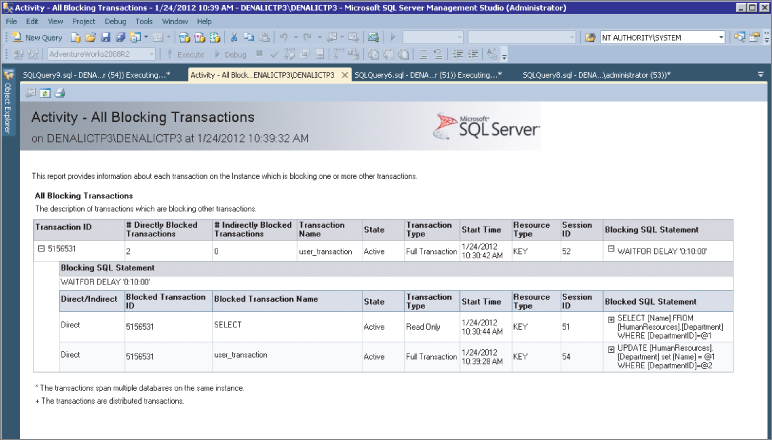
With Management Studio, transaction information for a server or database may be seen using the Standard Reports, available from the server or database context menu, which pull data from the dynamic management views. The transaction-related reports include All Transactions, All Blocking Transactions (shown in Figure 47.2), Top Transactions by Age, Top Transactions by Blocked Transaction Count, Top Transactions by Lock Count, Resource Locking by Object, and User Statistics.
Figure 47.2 Management Studio's All Blocking Transactions Report is a quick way to view key transaction locking and blocking information.

Viewing Blocking with Activity Monitor
Activity Monitor (see Figure 47.3) includes some useful bits of information that you can use to identify performance issues inside of SQL Server, including locking and blocking information. It's available on the toolbar and in the Object Explorer's server context menu.
Figure 47.3 Activity Monitor displays information about the current locks and any blocking going on. In this instance, spid 54 is blocked by spid 51, which is blocked by spid ...
Get Microsoft SQL Server 2012 Bible now with the O’Reilly learning platform.
O’Reilly members experience books, live events, courses curated by job role, and more from O’Reilly and nearly 200 top publishers.

