Exploring the Report Designer
Now that you have a report created inside the Report Designer, it is a good time to take a look around to become familiar with this environment.
The Design Surface
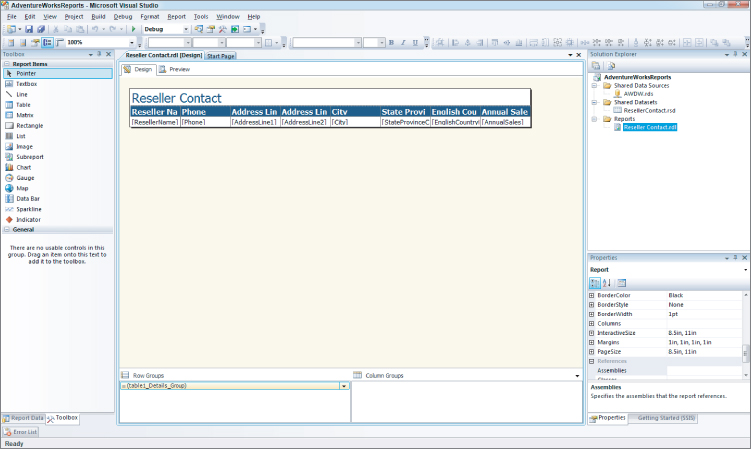
Figure 55.3 shows the Report Designer with the report you just created open in Design mode. When working with Reporting Services, you see many toolbars at the top of the screen. These can prove useful as shortcuts when formatting the report. For instance, there is a button for background color that you easily can use instead of using the properties box for a row. The area in the middle of the screen is the configurable portion of the report and is referred to as the design surface. Here you can drag items onto the report and format the report objects. To toggle between Design view and preview, click the Preview and Design tabs to the top left of the design surface.
Figure 55.3 The Reseller Contact report in Design view.

You can also add headers and footers to your report by going to the menu toolbar and selecting Report → Add Page Header or Report → Add Page Footer. Items in the header and footer sections appear on every page of the report.
Solution Explorer and Properties
On the right side of the screen is the Solution Explorer, which appears in any Visual Studio project. The items that are manipulated here in the context of a Reporting Services project are the Shared Data Sources, Shared ...
Get Microsoft SQL Server 2012 Bible now with the O’Reilly learning platform.
O’Reilly members experience books, live events, courses curated by job role, and more from O’Reilly and nearly 200 top publishers.

