Alternatives to Standard Deviation
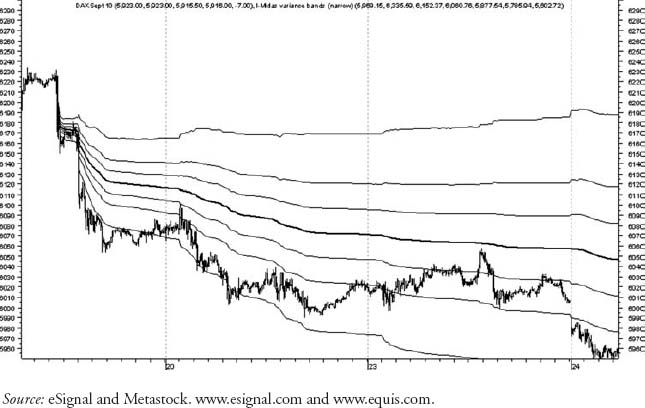
There are alternatives to calculating the MSDBs aside from using standard deviation. Figure 15.8 is a 5m chart of the DAX September 2010 futures with a three-day downtrend. Here standard deviation is replaced by variance in the basic calculation and the thick black curve is again a standard MIDAS resistance curve.
FIGURE 15.7 The same 3m chart of the DJ Eurostoxx 50 September 2010 futures illustrating the MIDAS standard deviation band (MSD).
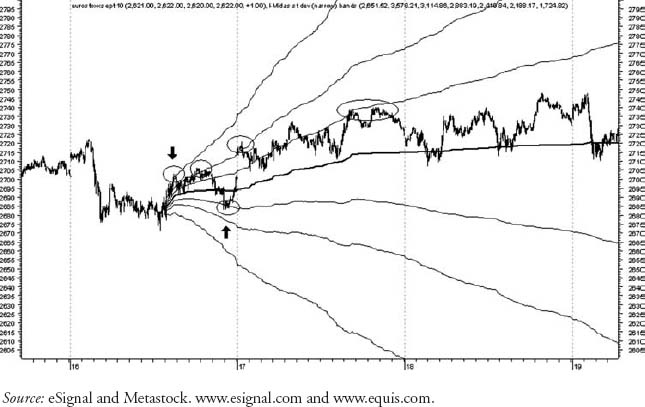
FIGURE 15.8 5m chart of DAX September 2010 futures with variance.
Get MIDAS Technical Analysis: A VWAP Approach to Trading and Investing in Today's Markets now with the O’Reilly learning platform.
O’Reilly members experience books, live events, courses curated by job role, and more from O’Reilly and nearly 200 top publishers.

