Volume–On Balance Volume Curves
I'm going to say very little about Volume–On Balance Curves (V-OBVs) because they share the same principles with N-OBVs. The difference is that while N-OBVs take a nominal “1” as input to the volume component of the algorithm, V-OBVs take the actual volume feed.
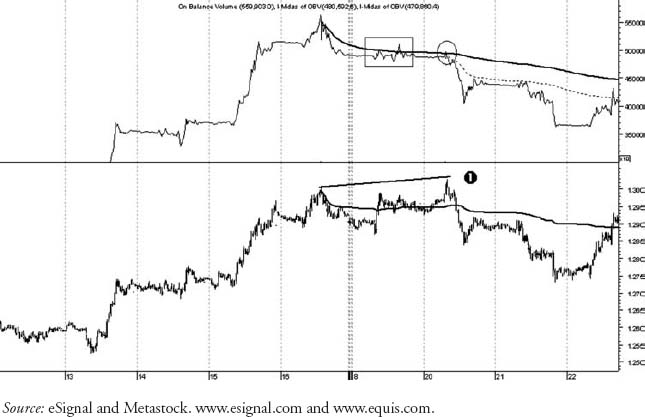
FIGURE 16.6 15m chart of euro September 2010 futures with a seven-day uptrend.
Let's illustrate a V-OBV curve alongside an N-OBV. Figure 16.7 is a daily cash chart of the Sydney All Ordinaries index from 2003 until the present. We see immediately in the lower price pane a standard MIDAS support curve (solid) launched from the 2003 low and being pulled up ...
Get MIDAS Technical Analysis: A VWAP Approach to Trading and Investing in Today's Markets now with the O’Reilly learning platform.
O’Reilly members experience books, live events, courses curated by job role, and more from O’Reilly and nearly 200 top publishers.

