Further Chart Illustrations
I complete this chapter with a few more charts (Figures 16.8–Figures 16.11) without chart commentary save for the brief descriptions that follow. In each case, standard MIDAS S/R curves will be plotted on the lower price pane with their shortcomings evident. The latter should be contrasted with the successful combination of the OBV line and the N-OBV and V-OBV curves in the upper pane.
FIGURE 16.7 Daily cash chart from 2003 to the present of the Sydney All Ordinaries illustrating a V-OBV curve (solid) in the top pane and an N-OBV curve (long dashes).
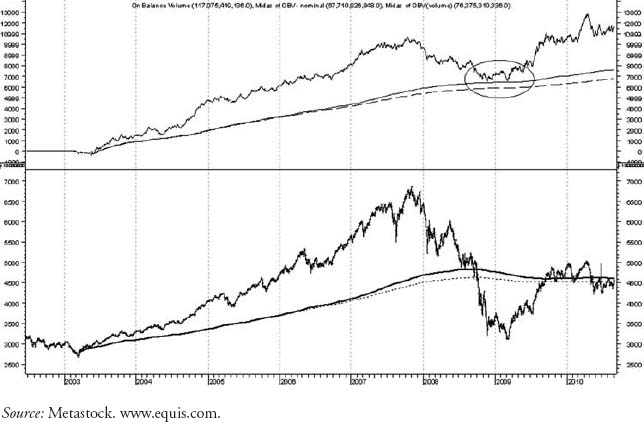
FIGURE 16.8 Henry Hub Natural Gas continuous futures with several ...
Get MIDAS Technical Analysis: A VWAP Approach to Trading and Investing in Today's Markets now with the O’Reilly learning platform.
O’Reilly members experience books, live events, courses curated by job role, and more from O’Reilly and nearly 200 top publishers.

