10.1 Annex 1 – Refresher on Probabilities and Statistical Modelling of Uncertainty
This section provides a short and elementary refresher on the basics of probabilistic and statistical modelling as a means of representing uncertain variables.
10.1.1 Modelling Through a Random Variable
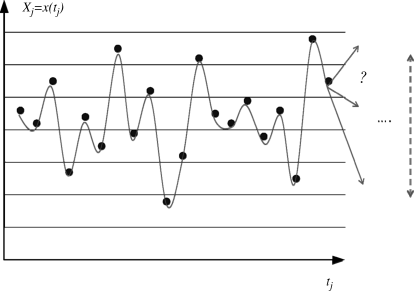
Suppose that a given property of the system denoted as x (temperature, toughness, oil price, water flow. . .) has been observed at several past times – or at a given date for several spatial locations, indivuals of a population, components of a system – issuing the following data sample or series of N = 20 observations x(tj) (Figure 10.1).
Figure 10.1 Erratic values of a property over time.

Two types of questions could be asked:
- What is the next value for the property (short-term)?
- What value would the property take in the future (possibly mean-term)?
A statistical (or probabilistic) representation of the variable X reckons that it is too hard to understand, causally explain and/or predict what happened in the observed data. No obvious regular pattern could be discerned so that it is quite puzzling to anticipate (i) what will happen at the next time step and even worse (ii) what will happen later on. The phenomenon is reckoned to be ‘erratic’ or ‘random-like’.
Instead of predicting precise values, a statistical approach limits itself to counting the frequency of occurrence of typical values in the ...
Get Modelling Under Risk and Uncertainty: An Introduction to Statistical, Phenomenological and Computational Methods now with the O’Reilly learning platform.
O’Reilly members experience books, live events, courses curated by job role, and more from O’Reilly and nearly 200 top publishers.

