6.10. NICHOLS CHART
The Nichols chart [21] is a very useful technique for determining stability and the closed-loop frequency response of a feedback system. Stability is determined from a plot of the open-loop gain versus phase characteristics. At the same time, the closed-loop frequency response of the system is determined by utilizing contours of constant closed-loop amplitude and phase shift which are overlaid on the gain-phase plot.
In order to derive the basic Nichols chart relationships, let us consider the unity-feedback system illustrated in Figure 6.45. The closed-loop transfer function is given by
![]()
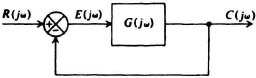
Figure 6.45 Block diagram of a simple feedback control system.
or
![]()
where M(ω) represents the amplitude component of the transfer function and α(ω) the phase component of the transfer function. The radian frequency at which the maximum value of C(jω)/R(jω) occurs is called the resonant frequency of the system, ωp, and the maximum value of C(jω)/R(jω) is denoted by Mp. For the system illustrated in Figure 6.45, we would expect a typical closed-loop frequency response to have the general form shown in Figure 6.46.
From Section 4.2 we know that a small margin of stability would mean ...
Get Modern Control System Theory and Design, 2nd Edition now with the O’Reilly learning platform.
O’Reilly members experience books, live events, courses curated by job role, and more from O’Reilly and nearly 200 top publishers.

