Chapter 4. The Ganglia Web Interface
So far, this book has dealt with the collection of data. Now we will discuss visualizing it. Visualization of these data is the primary responsibility of a web-based application known as gweb. This chapter is an introduction to gweb and its features. Whether the job is understanding how a problem began in your cluster or convincing management that more hardware is required, a picture is worth a thousand data points.
Navigating the Ganglia Web Interface
gweb is organizaed into a number of top-level tabs: Main, Search, Views, Aggregated Graphs, Compare Hosts, Events, Automatic Rotation, Live Dashboard, and Mobile. These tabs allow you to easily jump right to the information you need.
The gweb Main Tab
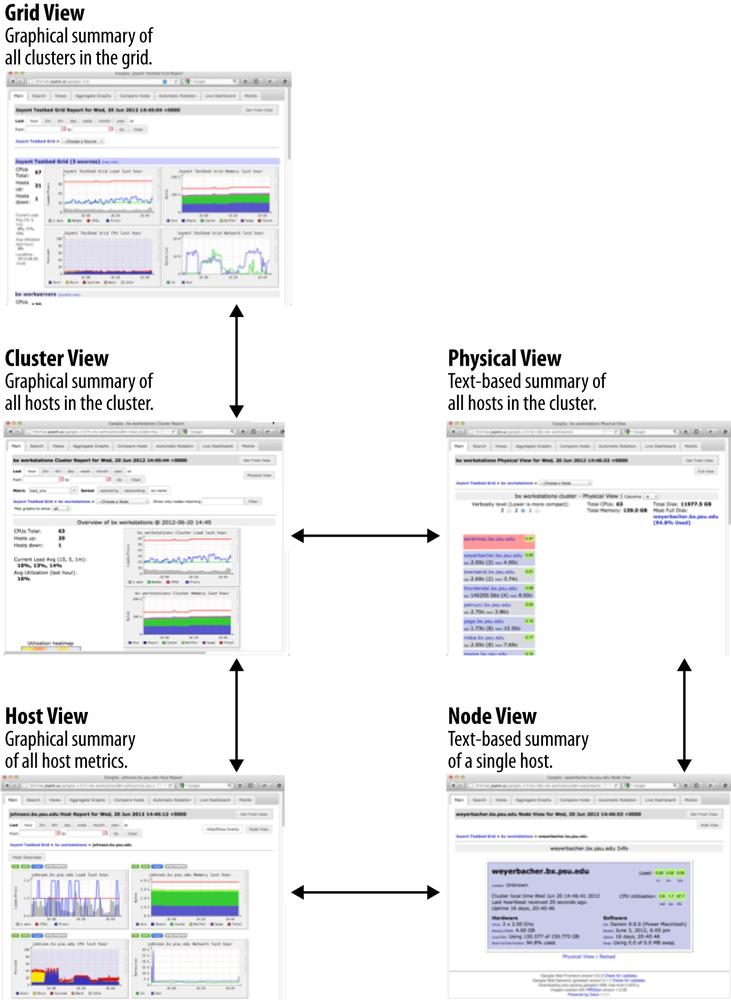
gweb’s navigation scheme is organized around Ganglia’s core concepts: grids, clusters, and nodes. As you click deeper into the hierarchy, breadcrumb-style navigation links allow you to return to higher-level views. Figure 4-1 shows how you can easily navigate to exactly the view of the data you want.
Grid View
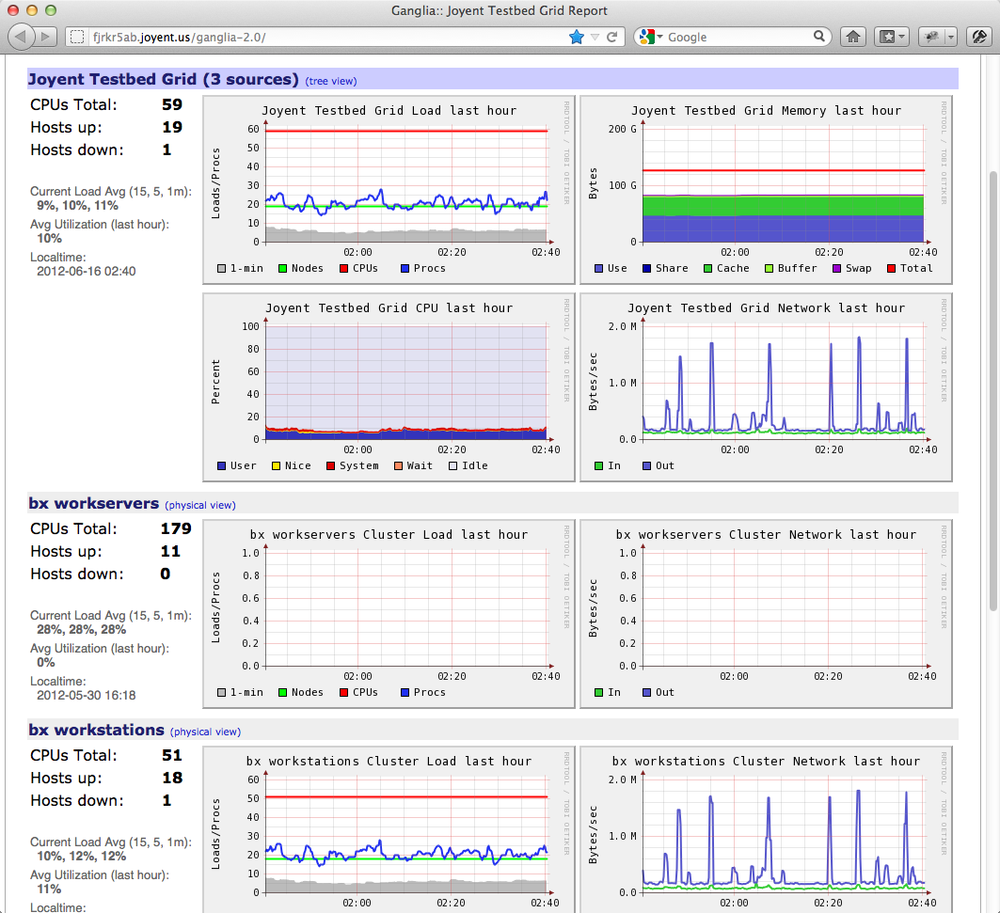
The grid view (Figure 4-2) provides the highest-level view available. Grid graphs summarize data across all hosts known to a single gmetad process. Grid view is the jumping-off point for navigating into more details displays dealing with individual clusters and the hosts that compose those clusters:
Clicking on any grid-level summary graphs brings up the all time periods display. Clicking again enlarges the graph you’re interested in.
Clicking on any cluster-level graph displays the cluster view.
Cluster View
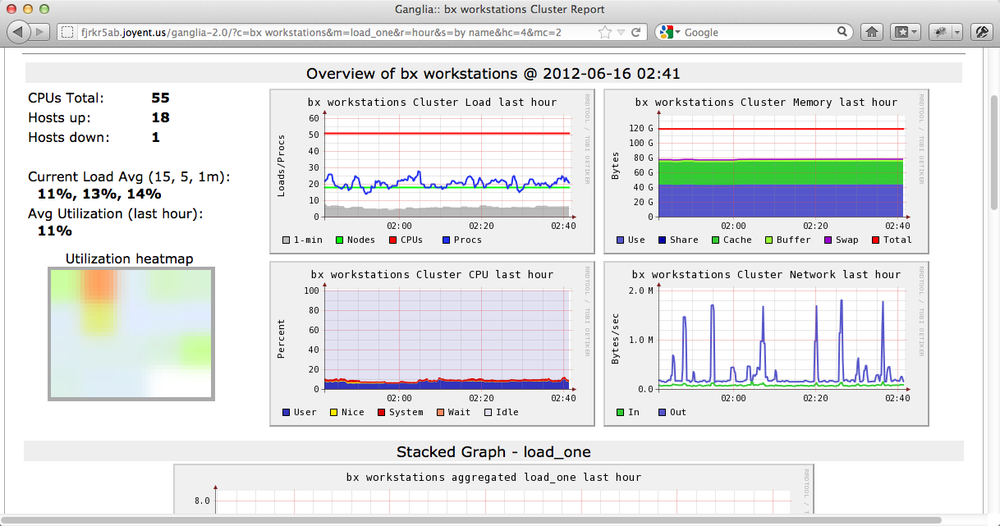
A cluster is a collection of gmonds. They may be grouped by physical location, common workload, or any other criteria. The top of the cluster view (Figure 4-3) displays summary graphs for the entire cluster. A quick view of each individual host is further down the page.
Clicking on a cluster summary shows you that summary of a range of time periods.
Clicking on an individual host takes you to the host display.
The background color of the host graphs is determined by their one-minute load average. The metric displayed for each host can be changed using the Metric select box near the top of the page.
The utilization heatmap provides an alternate display of the one-minute load averages. This is a very quick way to get a feeling for how evenly balanced the workload is in the cluster at the present time. The heatmap can be disabled by setting
$conf["heatmaps_enabled"]=0
in conf.php.
When working with a cluster with thousands of nodes, or when using
gweb over a slow network connection, loading a graph for each node in
the cluster can take a significant amount of time.
$conf["max_graphs"] can be defined in
conf.php to address this problem: to set an upper
limit on the number of host graphs that will be displayed in cluster
view.
Physical view
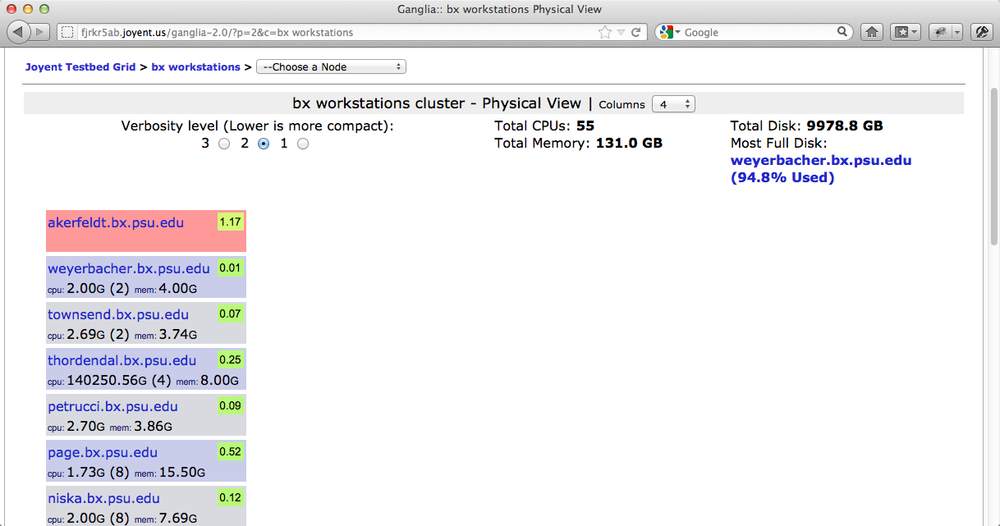
Cluster view also provides an alternative display known as physical view (Figure 4-4), which is also very useful for large clusters. Physical view is a compressed text-only display of all the nodes in a cluster. By omitting images, this view can render much more quickly than the main cluster view.
Clicking on a hostname in physical view takes you to the node view for that host. Node view is another text-only view, and is covered in more detail in Host View.
Adjusting the time range
Grid, cluster, and host views allow you to specify the time span (Figure 4-5) you’d like to see. Monitoring an ongoing event usually involves watching the last few minutes of data, but questions like “what is normal?” and “when did this start?” are often best answered over longer time scales.
You are free to define your own time spans as well via your conf.php file. The defaults (defined in conf_default.php) look like this:
  #
  # Time ranges
  # Each value is the # of seconds in that range.
  #
  $conf['time_ranges'] = array(
     'hour' => 3600,
     '2hr'  => 7200,
     '4hr'  => 14400,
     'day'  => 86400,
     'week' => 604800,
     'month'=> 2419200,
     'year' => 31449600
  );
All of the built-in time ranges are relative to the current time, which makes it difficult to see (for example) five minutes of data from two days ago, which can be a very useful view to have when doing postmortem research on load spikes and other problems. The time range interface allows manual entry of begin and end times and also supports zooming via mouse gestures.
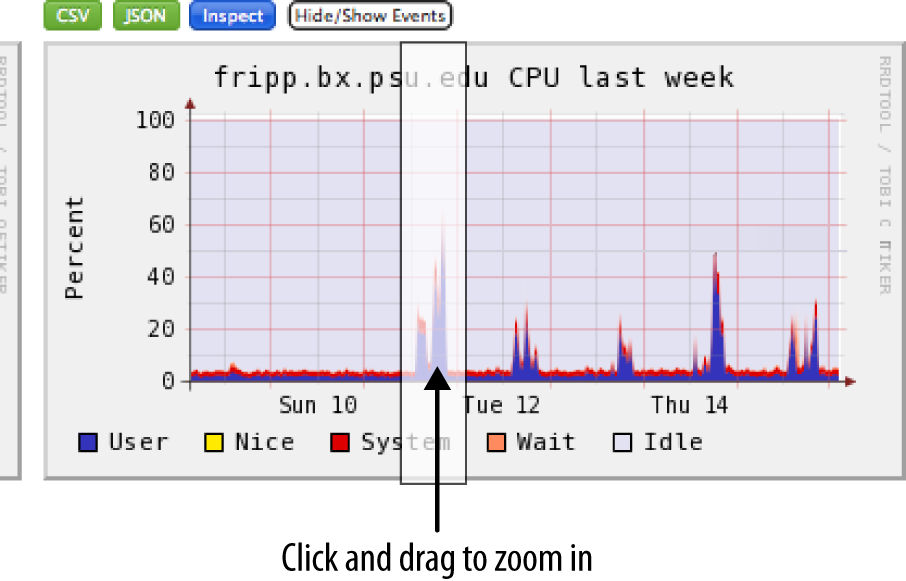
In both cluster and host views, it is possible to click and drag
on a graph to zoom in on a particular time frame (Figure 4-6). The interaction
causes the entire page to reload, using the desired time period. Note
that the resolution of the data displayed is limited by what is stored
in the RRD database files. After zooming, the time frame in use is
reflected in the custom time frame display at the
top of the page. You can clear this by clicking
clear and then go. Zoom
support is enabled by default but may be disabled by setting
$conf["zoom_support"] = 0 in
conf.php.
Host View
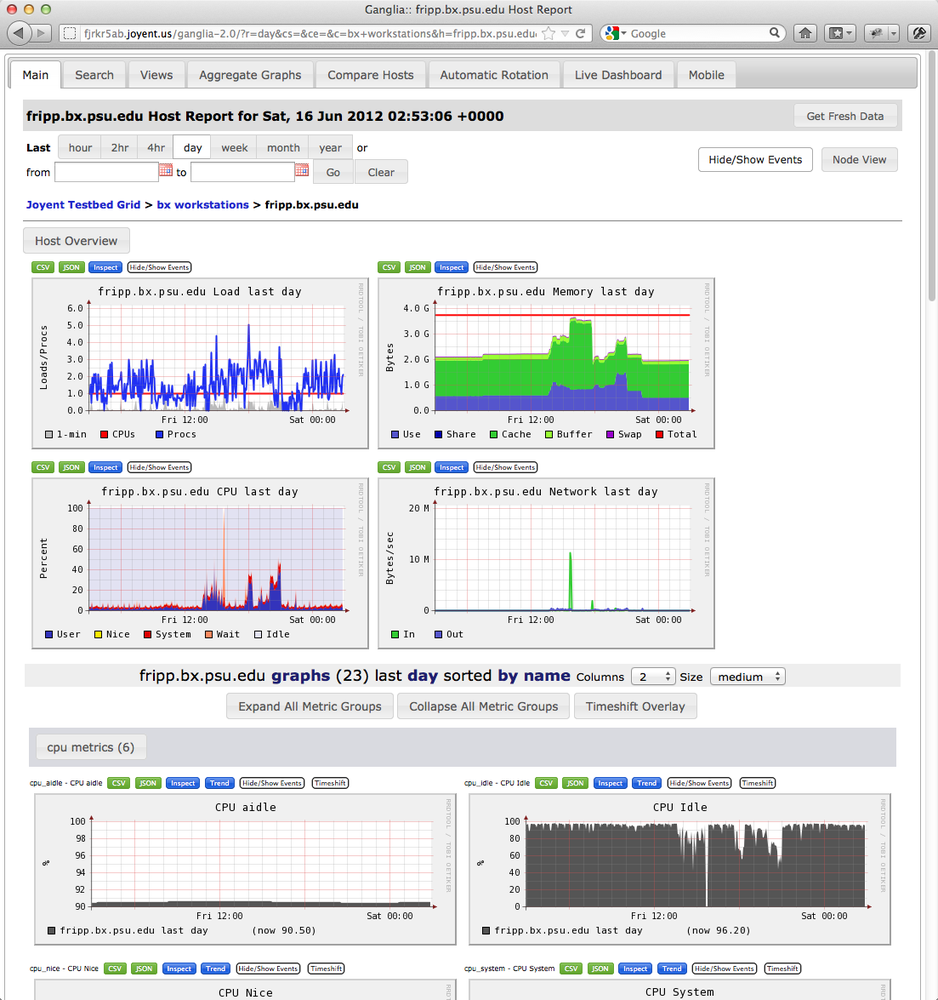
Metrics from a single gmond process are displayed and summarized in the host view (Figure 4-7). Summary graphs are displayed at the top, and individual metrics are grouped together lower down.
Host Overview contains textual information about the host, including any string metrics being reported by the host, such as last boot time or operating system and kernel version.
Viewing individual metrics
The “inspect” option for individual metrics, which is also available in the “all time periods” display, allows you to view the graph data interactively:
Raw graph data can be exported as CSV or JSON.
Events can be turned off and on selectively on all graphs or specific graphs.
Trend analysis can make predictions about future metric values based on past data.
Graph can be time-shifted to show overlay of previous period’s data.
Node view
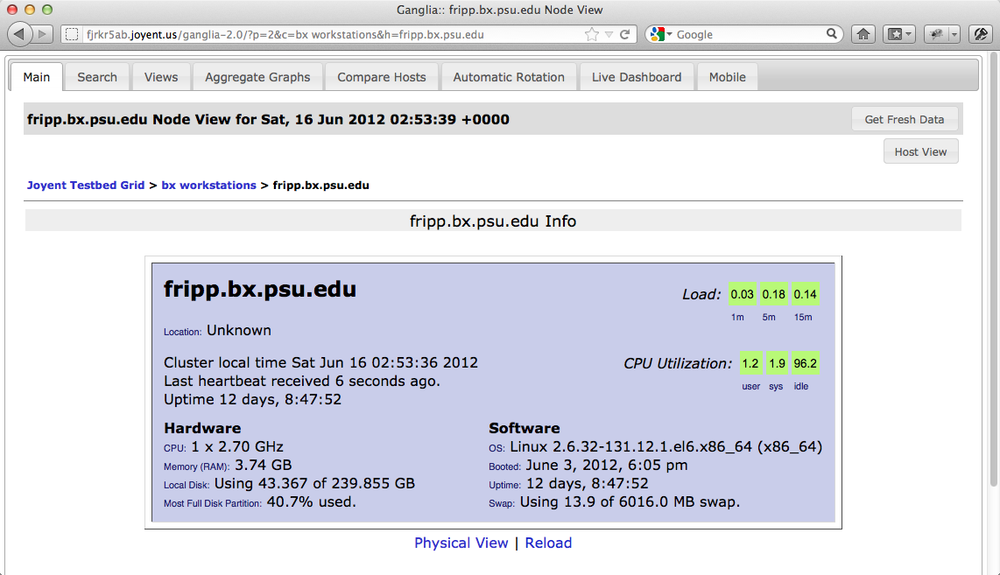
Node view (Figure 4-8) is an alternative text-only display of some very basic information about a host, similar to the physical view provided at the cluster level.
Graphing All Time Periods
Clicking on a summary graph at the top of the grid, cluster, or host views leads to an “all time periods” view of that graph. This display shows the same graph over a variety of time periods: typically the last hour, day, week, month, and year. This view is very useful when determining when a particular trend may have started or what normal is for a given metric.
Many of the options described for viewing individual metrics are also available for all time periods, include CSV and JSON export, interactive inspection, and event display.
The gweb Search Tab
Search allows you to find hosts and metrics quickly. It has multiple purposes:
Find a particular metric, which is especially useful if a metric is rare, such as
outgoing_sms_queue.Quickly find a host regardless of a cluster.
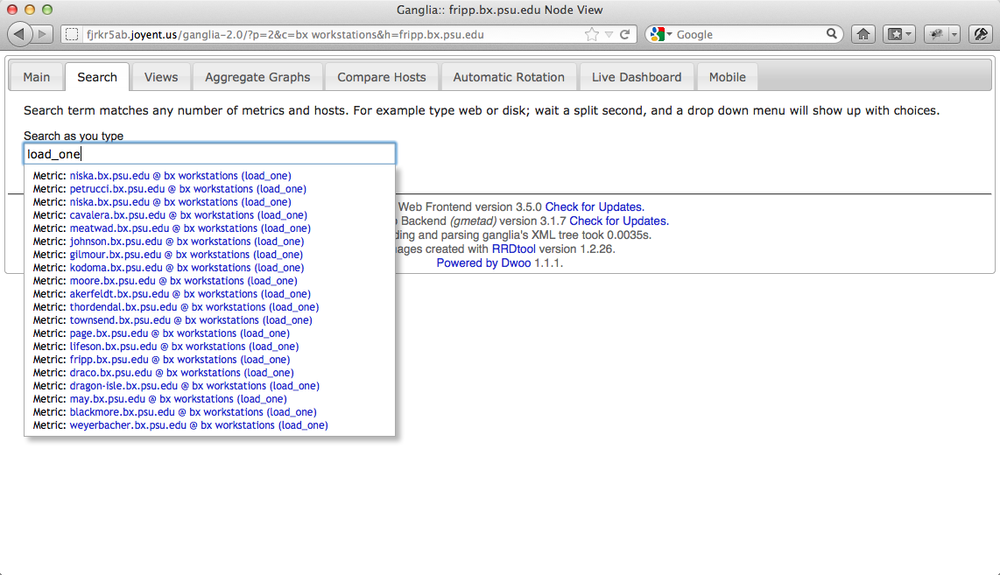
Figure 4-9 shows how gweb search autocomplete allows you to find metrics across your entire deployment. To use this feature, click on the Search tab and start typing in the search field. Once you stop typing, a list of results will appear. Results will contain:
A list of matching hosts.
A list of matching metrics. If the search term matches metrics on multiple hosts, all hosts will be shown.
Click on any of the links and a new window will open that will take you directly to the result. You can keep clicking on the results; for each result, a new window will open.
The gweb Views Tab
Views are an arbitrary collection of metrics, host report graphs, or aggregate graphs. They are intended to be a way for a user to specify things of which they want to have a single overview. For example, a user might want to see a view that contains aggregate load on all servers, aggregate throughput, load on the MySQL server, and so on. There are two ways to create/modify views: one is via the web GUI, and the other by programatically defining views using JSON.i
- Creating views using the GUI
To create views click the Views tab, then click Create View. Type your name, then click Create.
- Adding metrics to views using the GUI
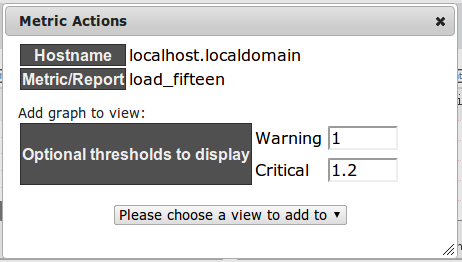
Click the plus sign above or below each metric or composite graph; a window will pop up in which you can select the view you want the metric to be added. Optionally, you can specify warning and critical values. Those values will appear as vertical lines on the graph. Repeat the process for consecutive metrics. Figure 4-10 shows the UI for adding a metric to a view.
- Defining views using JSON
Views are stored as JSON files in the conf_dir directory. The default for the conf_dir is /var/lib/ganglia/conf. You can change that by specifying an alternate directory in conf.php:
$conf['conf_dir'] = "/var/www/html/conf";
You can create or edit existing files. The filename for the view must start with
view_and end with.json(as in, view_1.json or view_jira_servers.json). It must be unique. Here is an example definition of a view that will result with a view with three different graphs:{ "view_name":"jira", "items":[ { "hostname":"web01.domain.com","graph":"cpu_report"}, { "hostname":"web02.domain.com","graph":"load_report"}, { "aggregate_graph":"true", "host_regex":[ {"regex":"web[2-7]"}, {"regex":"web50"} ], "metric_regex":[ {"regex":"load_one"} ], "graph_type":"stack", "title":"Location Web Servers load" } ], "view_type":"standard" }Table 4-1 lists the top-level attributes for the JSON view definition. Each item can have the attributes listed in Table 4-2.
Table 4-1. View itemsKey Value view_name Name of the view, which must be unique. view_type Standard or Regex. Regex view allows you to specify regex to match hosts. items An array of hashes describing which metrics should be part of the view. Table 4-2. Items configurationOnce you compose your graphs, it is often useful to validate JSON—for example, that you don’t have extra commas. To validate your JSON configuration, use Python’s
json.tool:$ python -m json.tool my_report.json
The gweb Aggregated Graphs Tab
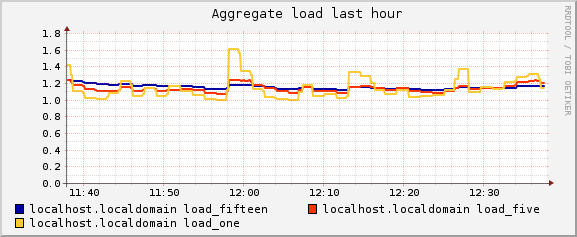
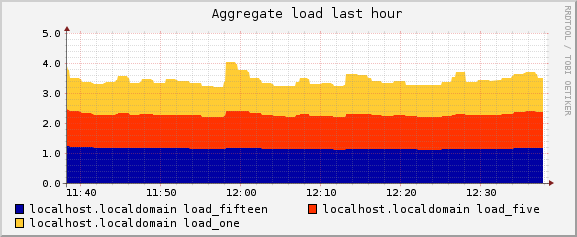
Aggregate graphs (Figure 4-11) allow you to create composite graphs combining different metrics. At a minimum, you must supply a host regular expression and metric regular expression. This is an extremely powerful feature, as it allows you to quickly and easily combine all sorts of metrics. Figure 4-12 includes two aggregate graphs showing all metrics matching host regex of loc and metric regex of load.
Decompose Graphs
Related to aggregate graphs are decompose graphs, which decompose aggregate graphs by taking each metric and putting it on a separate graph. This feature is useful when you have many different metrics on an aggregate graph and colors are blending together. You will find the Decompose button above the graph.
The gweb Compare Hosts Tab
The compare hosts feature allows you to compare hosts across all their matching metrics. It will basically create aggregate graphs for each metric. This feature is helpful when you want to observe why a particular host (or hosts) is behaving differently than other hosts.
The gweb Events Tab
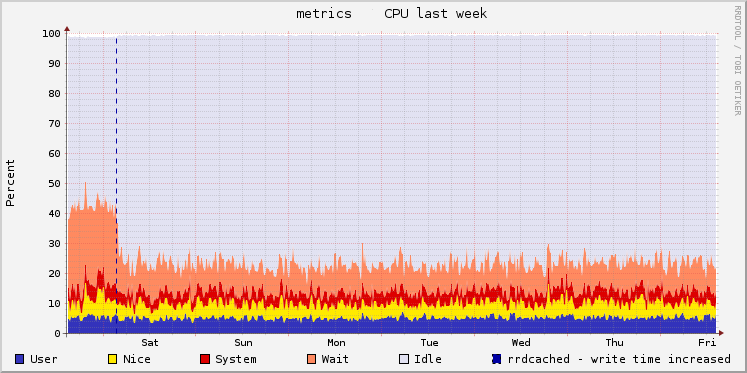
Events are user-specified “vertical markers” that are overlaid on
top of graphs. They are useful in providing visual cues when certain
events happen. For example, you might want to overlay software deploys or
backup jobs so that you can quickly associate change in behavior on
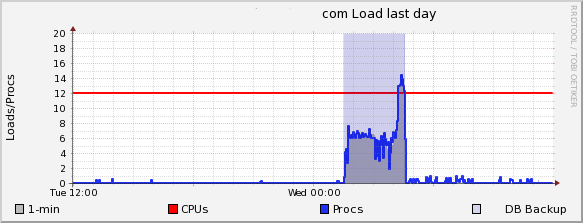
certain graphs to an external event, as in Figure 4-13. In this example, we wanted to see how
increased rrdcached write delay would affect our CPU
wait IO percentage, so we added an event when we made the
change.
Alternatively, you can overlay a timeline to indicate the duration of a particular event. For example, Figure 4-14 shows the full timeline for a backup job.
By default, Ganglia stores event in a JSON hash that is stored in the events.json file. This is an example JSON hash:
[
 { "event_id":"1234",
     "start_time":1308496361,
     "end_time":1308496961,
     "summary":"DB Backup",
     "description":"Prod daily db backup",
     "grid":"*",
     "cluster":"*",
     "host_regex":"centos1"
 },
 { "event_id":"2345",
     "start_time":1308497211,
     "summary":"FS cleanup",
     "grid":"*",
     "cluster":"*",
     "host_regex":"centos1"
 }
]
It is also possible to use a different backend for events, which can be useful if you need to scale up to hundreds or thousands of events without incurring the processing penalty associated with JSON parsing. This feature is configured with two configuration options in your conf_default.php file. You should have PHP support for MySQL installed on your gweb server before attempting to configure this support. The database schema can be imported from conf/sql/ganglia.mysql:
# What is the provider used to provide events
# Examples: "json", "mdb2"
$conf['overlay_events_provider'] = "mdb2";
# If using MDB2, connection string:
$conf['overlay_events_dsn'] = "mysql://dbuser:dbpassword@localhost/ganglia";
Alternatively, you can add events through the web UI or the API.
Events API
An easy way to manipulate events is through the Ganglia Events
API, which is available from your gweb interface at
/ganglia/api/events.php. To use it, invoke the URL
along with key/value pairs that define events. Key/value pairs can be
supplied as either GET or POST arguments. The full list of key/value
pairs is provided in Table 4-3.
| Key | Value |
| action | add to add a new event,
edit to edit, remove or
delete to remove an event. |
| start_time | Start time of an event. Allowed options are
now (uses current system time), UNIX
timestamp, or any other well-formed date, as supported by PHP’s
strtotime function. |
| end_time | Optional. Same format as
start_time. |
| summary | Summary of an event. It will be shown in the graph legend. |
| host_regex | Host regular expression, such as
web-|app-. |
Examples
To add an event from your cron job, execute a command such as:
curl "http://mygangliahost.com/ganglia/api/events.php?\
  action=add&start_time=now&\
  summary=Prod DB Backup&host_regex=db02"
or:
curl -X POST --data " action=add&start_time=now\
  &summary=Prod DB Backup&host_regex=db02" \
  http://mygangliahost.com/ganglia/api/events.php
API will return a JSON-encoded status message with either
status = ok or status = error.
If you are adding an event, you will also get the
event_id of the event that was just added in case
you want to edit it later, such as to add an
end_time.
The gweb Automatic Rotation Tab
Automatic rotation is a feature intended for people in data centers who need to continuously rotate metrics to help spot early signs of trouble. It is intended to work in conjunction with views. To activate it, click Automatic Rotation and then select the view you want rotated. Metrics will be rotated until the browser window is closed. You can change the view while the view is rotated; changes will be reflected within one full rotation. Graphs rotate every 30 seconds by default. You can adjust the rotation delay in the GUI.
Another powerful aspect of automatic rotation is that if you have multiple monitors, you can invoke different views to be rotated on different monitors.
The gweb Mobile Tab
gweb mobile represents the Ganglia web interface optimized for
mobile devices. This mobile view is found by visiting
/ganglia/mobile.php on your gweb host. It is intended
for any mobile browsers supported by the jQueryMobile toolkit. This
display covers most WebKit implementations, including Android, iPhone iOS,
HP webOS, Blackberry OS 6+, and Windows Phone 7. The mobile view contains
only a subset of features, including views optimized for a small screen,
host view, and search.
Custom Composite Graphs
Ganglia comes with a number of built-in composite graphs, such as a load report that shows current load, number of processes running, and number of CPUs; a CPU report that shows system CPU, user CPU, and wait IO CPU all on the same graph; and many others. You can define your own composite graphs in two ways: PHP or JSON.
Defining graphs via PHP is more complex but gives you complete control over every aspect of the graph. See the example PHP report for more details.
For typical use cases, JSON is definitely the easiest way to configure graphs. For example, consider the following JSON snippet, which will create a composite graph that shows all load indexes as lines on one graph:
{
   "report_name" : "load_all_report",
   "title" : "Load All Report",
   "vertical_label" : "load",
   "series" : [
      { "metric": "load_one", "color": "3333bb", "label": "Load 1",
        "line_width": "2", "type": "line" },
      { "metric": "load_five", "color": "ffea00", "label": "Load 5",
        "line_width": "2", "type": "line" },
      { "metric": "load_fifteen", "color": "dd0000", "label": "Load 15",
        "type": "line" }
   ]
}
To use this snippet, save it as a file and put it in the graph.d subdirectory of your gweb installation. The filename must contain _report.json in it to be considered by the web UI. So you can save this file in your gweb install as load_all_report.json.
There are two main sections to the JSON report. The first is a set of configurations for the overall report, and the second is a list of options for the specific data series that you wish to graph. The configuration options passed to the report are shown in Table 4-4.
| Key | Value |
| report_name | Name of the report that web UI uses. |
| title | Title of the report to show on a graph. |
| vertical_label | Y-axis description (optional). |
| series | An array of metrics to use to compose a graph. More about how those are defined in Table 4-5. |
Options for series array are listed in Table 4-5. Note that each series has its own instance of the different options.
| Key | Value |
| metric | Name of a metric, such as load_one and cpu_system. If the metric doesn’t exist it will be skipped. |
| color | A 6 hex-decimal color code, such as 000000 for black. |
| label | Metric label, such as Load 1. |
| type | Item type. It can be either line or stack. |
| line_width | If type is set to line, this value will be used as a line width. If this value is not specified, it defaults to 2. If type is stack, it’s ignored even if set. |
Once you compose your graphs, it is often useful to validate JSON.
One example would be to verify that there are no extra commas, etc. To
validate your JSON configuration, use Python’s
json.tool:
$ python -m json.tool my_report.json
This command will report any issues.
Other Features
There are a number of features in gweb that are turned off by default or can be adjusted:
- Metric groups initially collapsed
By default, when you click on a host view, all of the metric groups are expanded. You can change this view so that only metric graph titles are shown and you have to click on the metric group to expand the view. To make this collapsed view the default behavior, add the following setting to conf.php:
$conf['metric_groups_initially_collapsed'] = true;
- Filter hosts in cluster view
If you’d like to display only certain hosts in the cluster view, it is possible to filter them out using the text box that is located next to the “Show Node” dropdown. The filter accepts regular expressions, so it is possible to show any host that has “web” in its name by entering
webin the filter box; to show only webservers web10−web17, typeweb1[0-7]; or, to show web03 and web04 and all MySQL servers, type(web0[34]|mysql). Note that the aggregate graphs will still include data from all hosts, including those not displayed due to filters.- Default refresh period
The host and cluster view will refresh every 5 minutes (300 seconds). To adjust it, set the following value in conf.php:
$conf['default_refresh'] = 300;
- Strip domain name from hostname in graphs
By default, the gweb interface will display fully qualified domain names (FQDN) in graphs. If all your machines are on the same domain, you can strip the domain name by setting the
strip_domainnameoption in conf.php:$conf['strip_domainname'] = true;
- Set default time period
You can adjust the default time period shown by adjusting the following variable:
$conf['default_time_range'] = 'hour';
Authentication and Authorization
Ganglia contains a simple authorization system to selectively allow or deny users access to certain parts of the gweb application. We rely on the web server to provide authentication, so any Apache authentication system (htpasswd, LDAP, etc.) is supported. Apache configuration is used for examples in this section, but the system works with any web server that can provide the required environment variables.
Configuration
The authorization system has three modes of operation:
$conf['auth_system'] = 'readonly';Anyone is allowed to view any resource. No one can edit anything. This is the default setting.
$conf['auth_system'] = 'disabled';Anyone is allowed to view or edit any resource.
$conf['auth_system'] = 'enabled';Anyone may view public clusters without login. Authenticated users may gain elevated privileges.
If you wish to enable or disable authorization, add the change to your conf.php file.
When a user successfully authenticates, a hash is generated from the username and a secret key and is stored in a cookie and made available to the rest of gweb. If the secret key value becomes known, it is possible for an attacker to assume the identity of any user.
You can change this secret value at any time. Users who have already logged in will need to log in again.
Enabling Authentication
Enabling authentication requires two steps:
Configure your web server to require authentication when accessing gweb/login.php, and to provide the
$_SERVER['REMOTE_USER']variable to gweb/login.php. (This variable is not needed on any other gweb page.)Configure your web server to provide
$_SERVER['ganglia_secret']. This is a secret value used for hashing authenticated user names.
If login.php does not require authentication, the user will see an error message and no authorization will be allowed.
Sample Apache configuration
More information about configuring authentication in Apache can be found here. Note that Apache need only provide authentication; authorization is provided by gweb configuration. A sample Apache configuration is provided here:
SetEnv ganglia_secret yourSuperSecretValueGoesHere
<Files "login.php">
  AuthType Basic
  AuthName "Ganglia Access"
  AuthUserFile /var/lib/ganglia/htpasswd
  Require valid-user
</Files>
Other web servers
Sample configurations for other web servers such as Nginx and Lighttpd are available on the gweb wiki.
Access Controls
The default access control setup has the following properties:
Guests may view all public clusters.
Admins may view all public and private clusters and edit configuration (views) for them.
Guests may not view private clusters.
Additional rules may be configured as required. This configuration
should go in conf.php. The GangliaAcl
configuration property is based on the Zend_Acl property.
More documentation is available here.
Note that there is no built-in distinction between a
user and a group in
Zend_Acl. Both are implemented as roles. The system
supports the configuration of hierarchical sets of ACL rules. We
implement user/group semantics by making all user roles children of the
GangliaAcl::GUEST role, and all clusters children of
GangliaAcl::ALL:
| Name | Meaning |
| Every cluster should
descend from this role. Guests have view
access on |
| Every user should descend from this role. (Users may also have other roles, but this one grants global view privileges to public clusters.) |
| Admins may access all private clusters and edit configuration for any cluster. |
| This permission is granted to guests on all clusters, and then selectively denied for private clusters. |
| This permission is used to determine whether a user may update views and perform any other configuration tasks. |
Actions
Currently, we only support two actions, view and edit. These are applied on a per-cluster basis. So one user may have view access to all clusters, but edit access to only one.
Configuration Examples
These should go in your conf.php file. The usernames you use must be the ones provided by whatever authentication system you are using in Apache. If you want to explicitly allow/deny access to certain clusters, you need to spell that out here.
All later examples assume you have this code to start with:
$acl = GangliaAcl::getInstance();
- Making a user an admin
$acl->addRole( 'username', GangliaAcl::ADMIN );
- Defining a private cluster
$acl->addPrivateCluster( 'clustername' );
- Granting certain users access to a private cluster
$acl->addPrivateCluster( 'clustername' );
$acl->addRole( 'username', GangliaAcl::GUEST );
$acl->allow( 'username', 'clustername', GangliaAcl::VIEW );
- Granting users access to edit some clusters
$acl->addRole( 'username', GangliaAcl::GUEST );
$acl->add( new Zend_Acl_Resource( 'clustername' ), GangliaAcl::ALL_CLUSTERS );
$acl->allow( 'username', 'clustername', GangliaAcl::EDIT );
Get Monitoring with Ganglia now with the O’Reilly learning platform.
O’Reilly members experience books, live events, courses curated by job role, and more from O’Reilly and nearly 200 top publishers.
