15. Summarizing Data with PivotTables
In this chapter, you’ll learn how to use a PivotTable to quickly summarize data. This chapter covers the following topics:
→ Sorting and filtering a PivotTable
→ Grouping dates in a PivotTable
→ Inserting slicers to help users filter a PivotTable
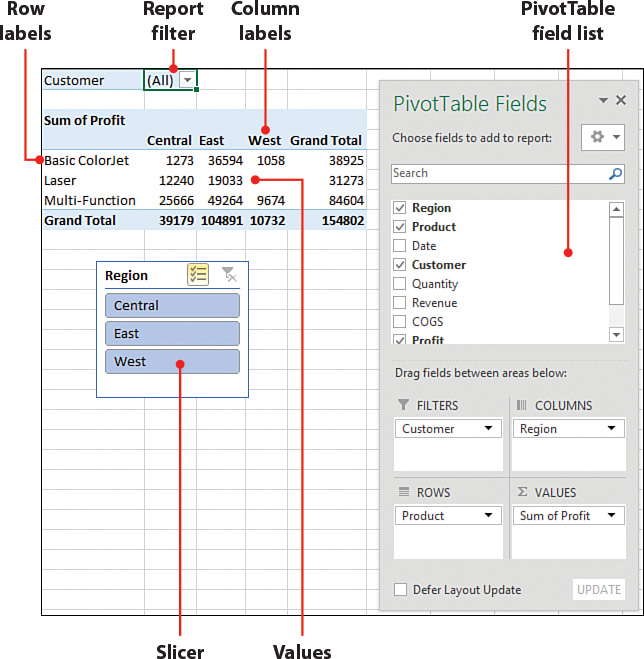
You can use a PivotTable to summarize a million rows with five clicks of the mouse button. For example, if you have sales data broken up by company and product, you can quickly summarize the sales by company, then product, or, with a few clicks, you can reverse the report and summarize by product, then company. Suppose you’re in charge of all ...
Get My Excel 2016 now with the O’Reilly learning platform.
O’Reilly members experience books, live events, courses curated by job role, and more from O’Reilly and nearly 200 top publishers.

