RGB Histogram mode
RGB Histogram mode displays your image as shown on the left in Figure 5-17. (Remember: You can view your picture in this mode only if you enable it via the Playback Display Options setting on the Playback menu.)
The data underneath the thumbnail shows the White Balance settings used for the shot. (White balance is a color feature you can explore in Chapter 8.) The first value tells you the setting (Auto 1, in the figure), and the two number values tell you whether you fine-tuned that setting along the amber to blue axis (first value) or green to magenta axis (second value). Zeros, as in the figure, indicate no fine-tuning. You also see the Protect Status key and Retouch Indicator symbol if you use those features on the image.
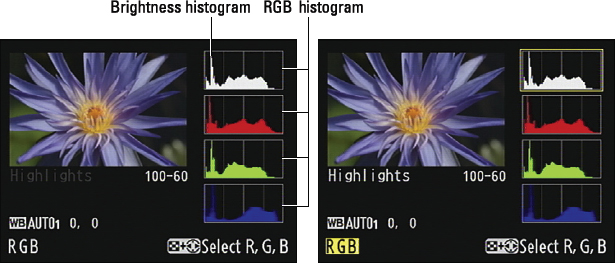
Figure 5-17: In RGB Histogram mode (left), press the ISO button to add the Highlights blinkies to the mix (right).
In addition, you get four charts, called histograms. You actually get two types of histograms: The top one is a Brightness histogram and reflects the composite, three-channel image data. The three others represent the data for the single red, green, and blue channels. This trio is sometimes called an RGB histogram, thus the display mode name.
The next two sections explain what information you can glean from the two types of histograms. But first, here are two quick tips:
- Adding Highlights data: As with Highlights mode, you ...
Get Nikon D600 For Dummies now with the O’Reilly learning platform.
O’Reilly members experience books, live events, courses curated by job role, and more from O’Reilly and nearly 200 top publishers.

