Chapter 1. Optimization and Performance Defined
Optimizing the performance of Java (or any other sort of code) is often seen as a Dark Art. Thereâs a mystique about performance analysisâitâs commonly viewed as a craft practiced by the âlone hacker, who is tortured and deep thinkingâ (one of Hollywoodâs favorite tropes about computers and the people who operate them). The image is one of a single individual who can see deeply into a system and come up with a magic solution that makes the system work faster.
This image is often coupled with the unfortunate (but all-too-common) situation where performance is a second-class concern of the software teams. This sets up a scenario where analysis is only done once the system is already in trouble, and so needs a performance âheroâ to save it. The reality, however, is a little different.
The truth is that performance analysis is a weird blend of hard empiricism and squishy human psychology. What matters is, at one and the same time, the absolute numbers of observable metrics and how the end users and stakeholders feel about them. The resolution of this apparent paradox is the subject of the rest of this book.
Java PerformanceâThe Wrong Way
For many years, one of the top three hits on Google for âJava performance tuningâ was an article from 1997â8, which had been ingested into the index very early in Googleâs history. The page had presumably stayed close to the top because its initial ranking served to actively drive traffic to it, creating a feedback loop.
The page housed advice that was completely out of date, no longer true, and in many cases detrimental to applications. However, its favored position in the search engine results caused many, many developers to be exposed to terrible advice.
For example, very early versions of Java had terrible method dispatch performance. As a workaround, some Java developers advocated avoiding writing small methods and instead writing monolithic methods. Of course, over time, the performance of virtual dispatch greatly improved. Not only that, but with modern Java Virtual Machines (JVMs) and especially automatic managed inlining, virtual dispatch has now been eliminated at the majority of call sites. Code that followed the âlump everything into one methodâ advice is now at a substantial disadvantage, as it is very unfriendly to modern Just-in-Time (JIT) compilers.
Thereâs no way of knowing how much damage was done to the performance of applications that were subjected to the bad advice, but this case neatly demonstrates the dangers of not using a quantitative and verifiable approach to performance. It also provides another excellent example of why you shouldnât believe everything you read on the internet.
Note
The execution speed of Java code is highly dynamic and fundamentally depends on the underlying Java Virtual Machine. An old piece of Java code may well execute faster on a more recent JVM, even without recompiling the Java source code.
As you might imagine, for this reason (and others we will discuss later) this book is not a cookbook of performance tips to apply to your code. Instead, we focus on a range of aspects that come together to produce good performance engineering:
-
Performance methodology within the overall software lifecycle
-
Theory of testing as applied to performance
-
Measurement, statistics, and tooling
-
Analysis skills (both systems and data)
-
Underlying technology and mechanisms
Later in the book, we will introduce some heuristics and code-level techniques for optimization, but these all come with caveats and tradeoffs that the developer should be aware of before using them.
Tip
Please do not skip ahead to those sections and start applying the techniques detailed without properly understanding the context in which the advice is given. All of these techniques are capable of doing more harm than good if you lack a proper understanding of how they should be applied.
In general, there are:
-
No magic âgo fasterâ switches for the JVM
-
No âtips and tricksâ to make Java run faster
-
No secret algorithms that have been hidden from you
As we explore our subject, we will discuss these misconceptions in more detail, along with some other common mistakes that developers often make when approaching Java performance analysis and related issues. Still here? Good. Then letâs talk about performance.
Java Performance Overview
To understand why Java performance is the way that it is, letâs start by considering a classic quote from James Gosling, the creator of Java:
Java is a blue collar language. Itâs not PhD thesis material but a language for a job.
That is, Java has always been an extremely practical language. Its attitude to performance was initially that as long as the environment was fast enough, then raw performance could be sacrificed if developer productivity benefited. It was therefore not until relatively recently, with the increasing maturity and sophistication of JVMs such as HotSpot, that the Java environment became suitable for high-performance computing applications.
This practicality manifests itself in many ways in the Java platform, but one of the most obvious is the used of managed subsystems. The idea is that the developer gives up some aspects of low-level control in exchange for not having to worry about some of the details of the capability under management.
The most obvious example of this is, of course, memory management. The JVM provides automatic memory management in the form of a pluggable garbage collection subsystem, so that memory does not have to be manually tracked by the programmer.
Note
Managed subsystems occur throughout the JVM and their existence introduces extra complexity into the runtime behavior of JVM applications.
As we will discuss in the next section, the complex runtime behavior of JVM applications requires us to treat our applications as experiments under test. This leads us to think about the statistics of observed measurements, and here we make an unfortunate discovery.
The observed performance measurements of JVM applications are very often not normally distributed. This means that elementary statistical techniques (e.g., standard deviation and variance) are ill-suited for handling results from JVM applications. This is because many basic statistics methods contain an implicit assumption about the normality of results distributions.
One way to understand this is that for JVM applications outliers can be very significantâfor a low-latency trading application, for example. This means that sampling of measurements is also problematic, as it can easily miss the exact events that have the most importance.
Finally, a word of caution. It is very easy to be misled by Java performance measurements. The complexity of the environment means that it is very hard to isolate individual aspects of the system.
Measurement also has an overhead, and frequent sampling (or recording every result) can have an observable impact on the performance numbers being recorded. The nature of Java performance numbers requires a certain amount of statistical sophistication, and naive techniques frequently produce incorrect results when applied to Java/JVM applications.
Performance as an Experimental Science
Java/JVM software stacks are, like most modern software systems, very complex. In fact, due to the highly optimizing and adaptive nature of the JVM, production systems built on top of the JVM can have some incredibly subtle and intricate performance behavior. This complexity has been made possible by Mooreâs Law and the unprecedented growth in hardware capability that it represents.
The most amazing achievement of the computer software industry is its continuing cancellation of the steady and staggering gains made by the computer hardware industry.
Henry Petroski
While some software systems have squandered the historical gains of the industry, the JVM represents something of an engineering triumph. Since its inception in the late 1990s the JVM has developed into a very high-performance, general-purpose execution environment that puts those gains to very good use. The tradeoff, however, is that like any complex, high-performance system, the JVM requires a measure of skill and experience to get the absolute best out of it.
A measurement not clearly defined is worse than useless.
Eli Goldratt
JVM performance tuning is therefore a synthesis between technology, methodology, measurable quantities, and tools. Its aim is to effect measurable outputs in a manner desired by the owners or users of a system. In other words, performance is an experimental scienceâit achieves a desired result by:
-
Defining the desired outcome
-
Measuring the existing system
-
Determining what is to be done to achieve the requirement
-
Undertaking an improvement exercise
-
Retesting
-
Determining whether the goal has been achieved
The process of defining and determining desired performance outcomes builds a set of quantitative objectives. It is important to establish what should be measured and record the objectives, which then form part of the projectâs artifacts and deliverables. From this, we can see that performance analysis is based upon defining, and then achieving, nonfunctional requirements.
This process is, as has been previewed, not one of reading chicken entrails or another divination method. Instead, we rely upon statistics and an appropriate handling of results. In Chapter 5 we will introduce a primer on the basic statistical techniques that are required for accurate handling of data generated from a JVM performance analysis project.
For many real-world projects, a more sophisticated understanding of data and statistics will undoubtedly be required. You are encouraged to view the statistical techniques found in this book as a starting point, rather than a definitive statement.
A Taxonomy for Performance
In this section, we introduce some basic performance metrics. These provide a vocabulary for performance analysis and will allow you to frame the objectives of a tuning project in quantitative terms. These objectives are the nonfunctional requirements that define performance goals. One common basic set of performance metrics is:
-
Throughput
-
Latency
-
Capacity
-
Utilization
-
Efficiency
-
Scalability
-
Degradation
We will briefly discuss each in turn. Note that for most performance projects, not every metric will be optimized simultaneously. The case of only a few metrics being improved in a single performance iteration is far more common, and this may be as many as can be tuned at once. In real-world projects, it may well be the case that optimizing one metric comes at the detriment of another metric or group of metrics.
Throughput
Throughput is a metric that represents the rate of work a system or subsystem can perform. This is usually expressed as number of units of work in some time period. For example, we might be interested in how many transactions per second a system can execute.
For the throughput number to be meaningful in a real performance exercise, it should include a description of the reference platform it was obtained on. For example, the hardware spec, OS, and software stack are all relevant to throughput, as is whether the system under test is a single server or a cluster. In addition, transactions (or units of work) should be the same between tests. Essentially, we should seek to ensure that the workload for throughput tests is kept consistent between runs.
Latency
Performance metrics are sometimes explained via metaphors that evoke plumbing. If a water pipe can produce 100 liters per second, then the volume produced in 1 second (100 liters) is the throughput. In this metaphor, the latency is effectively the length of the pipe. That is, itâs the time taken to process a single transaction and see a result at the other end of the pipe.
It is normally quoted as an end-to-end time. It is dependent on workload, so a common approach is to produce a graph showing latency as a function of increasing workload. We will see an example of this type of graph in âReading Performance Graphsâ.
Capacity
The capacity is the amount of work parallelism a system possessesâthat is, the number of units of work (e.g., transactions) that can be simultaneously ongoing in the system.
Capacity is obviously related to throughput, and we should expect that as the concurrent load on a system increases, throughput (and latency) will be affected. For this reason, capacity is usually quoted as the processing available at a given value of latency or throughput.
Utilization
One of the most common performance analysis tasks is to achieve efficient use of a systemâs resources. Ideally, CPUs should be used for handling units of work, rather than being idle (or spending time handling OS or other housekeeping tasks).
Depending on the workload, there can be a huge difference between the utilization levels of different resources. For example, a computation-intensive workload (such as graphics processing or encryption) may be running at close to 100% CPU but only be using a small percentage of available memory.
Efficiency
Dividing the throughput of a system by the utilized resources gives a measure of the overall efficiency of the system. Intuitively, this makes sense, as requiring more resources to produce the same throughput is one useful definition of being less efficient.
It is also possible, when one is dealing with larger systems, to use a form of cost accounting to measure efficiency. If solution A has a total dollar cost of ownership (TCO) twice that of solution B for the same throughput then it is, clearly, half as efficient.
Scalability
The throughout or capacity of a system depends upon the resources available for processing. The change in throughput as resources are added is one measure of the scalability of a system or application. The holy grail of system scalability is to have throughput change exactly in step with resources.
Consider a system based on a cluster of servers. If the cluster is expanded, for example, by doubling in size, then what throughput can be achieved? If the new cluster can handle twice the volume of transactions, then the system is exhibiting âperfect linear scaling.â This is very difficult to achieve in practice, especially over a wide range of possible loads.
System scalability is dependent upon a number of factors, and is not normally a simple constant factor. It is very common for a system to scale close to linearly for some range of resources, but then at higher loads to encounter some limitation that prevents perfect scaling.
Degradation
If we increase the load on a system, either by increasing the number of requests (or clients) or by increasing the speed requests arrive at, then we may see a change in the observed latency and/or throughput.
Note that this change is dependent on utilization. If the system is underutilized, then there should be some slack before observables change, but if resources are fully utilized then we would expect to see throughput stop increasing, or latency increase. These changes are usually called the degradation of the system under additional load.
Connections Between the Observables
The behavior of the various performance observables is usually connected in some manner. The details of this connection will depend upon whether the system is running at peak utility. For example, in general, the utilization will change as the load on a system increases. However, if the system is underutilized, then increasing load may not appreciably increase utilization. Conversely, if the system is already stressed, then the effect of increasing load may be felt in another observable.
As another example, scalability and degradation both represent the change in behavior of a system as more load is added. For scalability, as the load is increased, so are available resources, and the central question is whether the system can make use of them. On the other hand, if load is added but additional resources are not provided, degradation of some performance observable (e.g., latency) is the expected outcome.
Note
In rare cases, additional load can cause counterintuitive results. For example, if the change in load causes some part of the system to switch to a more resource-intensive but higher-performance mode, then the overall effect can be to reduce latency, even though more requests are being received.
To take one example, in Chapter 9 we will discuss HotSpotâs JIT compiler in detail. To be considered eligible for JIT compilation, a method has to be executed in interpreted mode âsufficiently frequently.â So it is possible at low load to have key methods stuck in interpreted mode, but for those to become eligible for compilation at higher loads due to increased calling frequency on the methods. This causes later calls to the same method to run much, much faster than earlier executions.
Different workloads can have very different characteristics. For example, a trade on the financial markets, viewed end to end, may have an execution time (i.e., latency) of hours or even days. However, millions of them may be in progress at a major bank at any given time. Thus, the capacity of the system is very large, but the latency is also large.
However, letâs consider only a single subsystem within the bank. The matching of a buyer and a seller (which is essentially the parties agreeing on a price) is known as order matching. This individual subsystem may have only hundreds of pending orders at any given time, but the latency from order acceptance to completed match may be as little as 1 millisecond (or even less in the case of âlow-latencyâ trading).
In this section we have met the most frequently encountered performance observables. Occasionally slightly different definitions, or even different metrics, are used, but in most cases these will be the basic system numbers that will normally be used to guide performance tuning, and act as a taxonomy for discussing the performance of systems of interest.
Reading Performance Graphs
To conclude this chapter, letâs look at some common patterns of behavior that occur in performance tests. We will explore these by looking at graphs of real observables, and we will encounter many other examples of graphs of our data as we proceed.
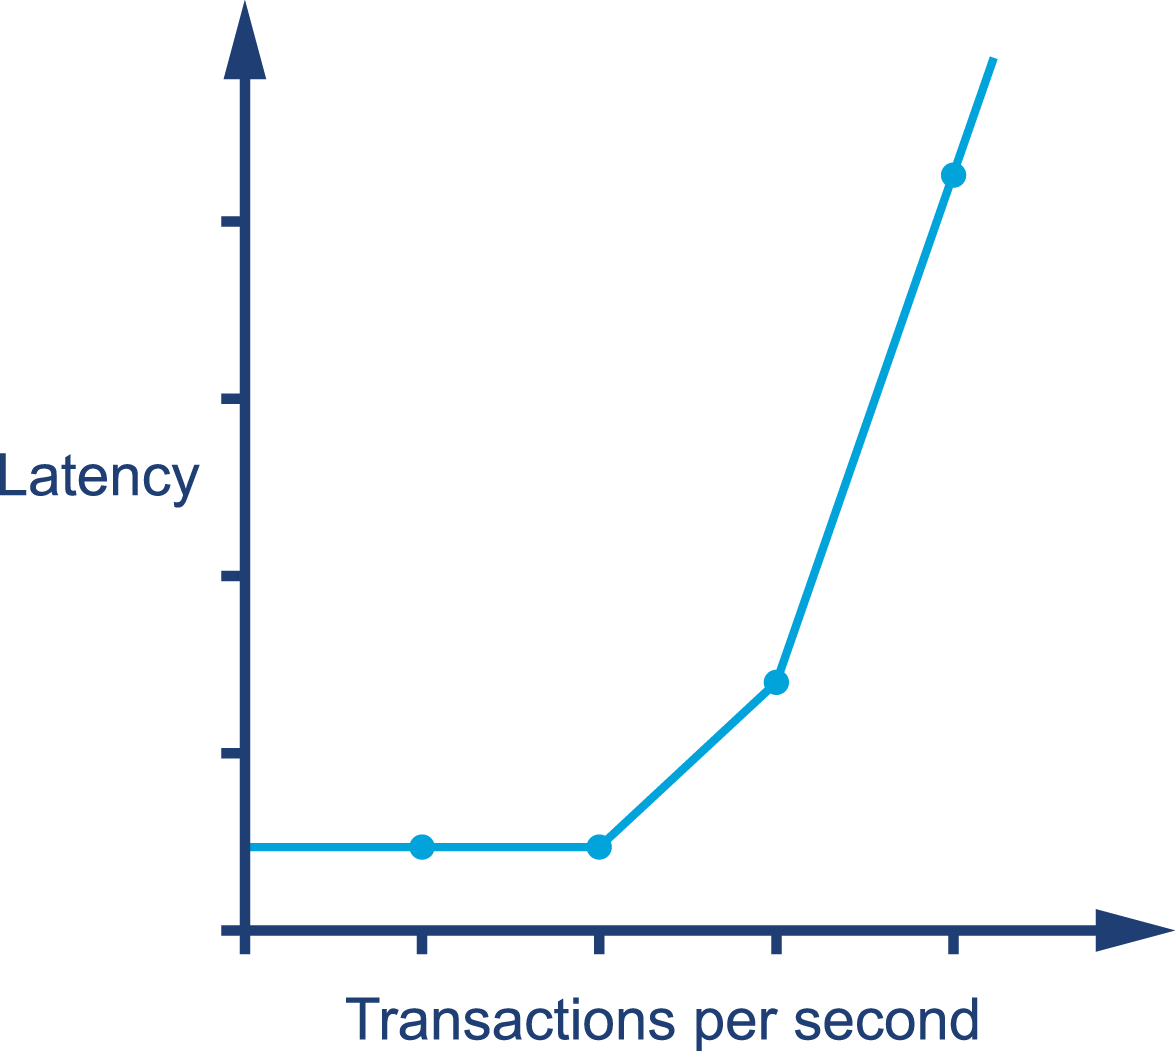
The graph in Figure 1-1 shows sudden, unexpected degradation of performance (in this case, latency) under increasing loadâcommonly called a performance elbow.

Figure 1-1. A performance elbow
By contrast, Figure 1-2 shows the much happier case of throughput scaling almost linearly as machines are added to a cluster. This is close to ideal behavior, and is only likely to be achieved in extremely favorable circumstancesâe.g., scaling a stateless protocol with no need for session affinity with a single server.

Figure 1-2. Near-linear scaling
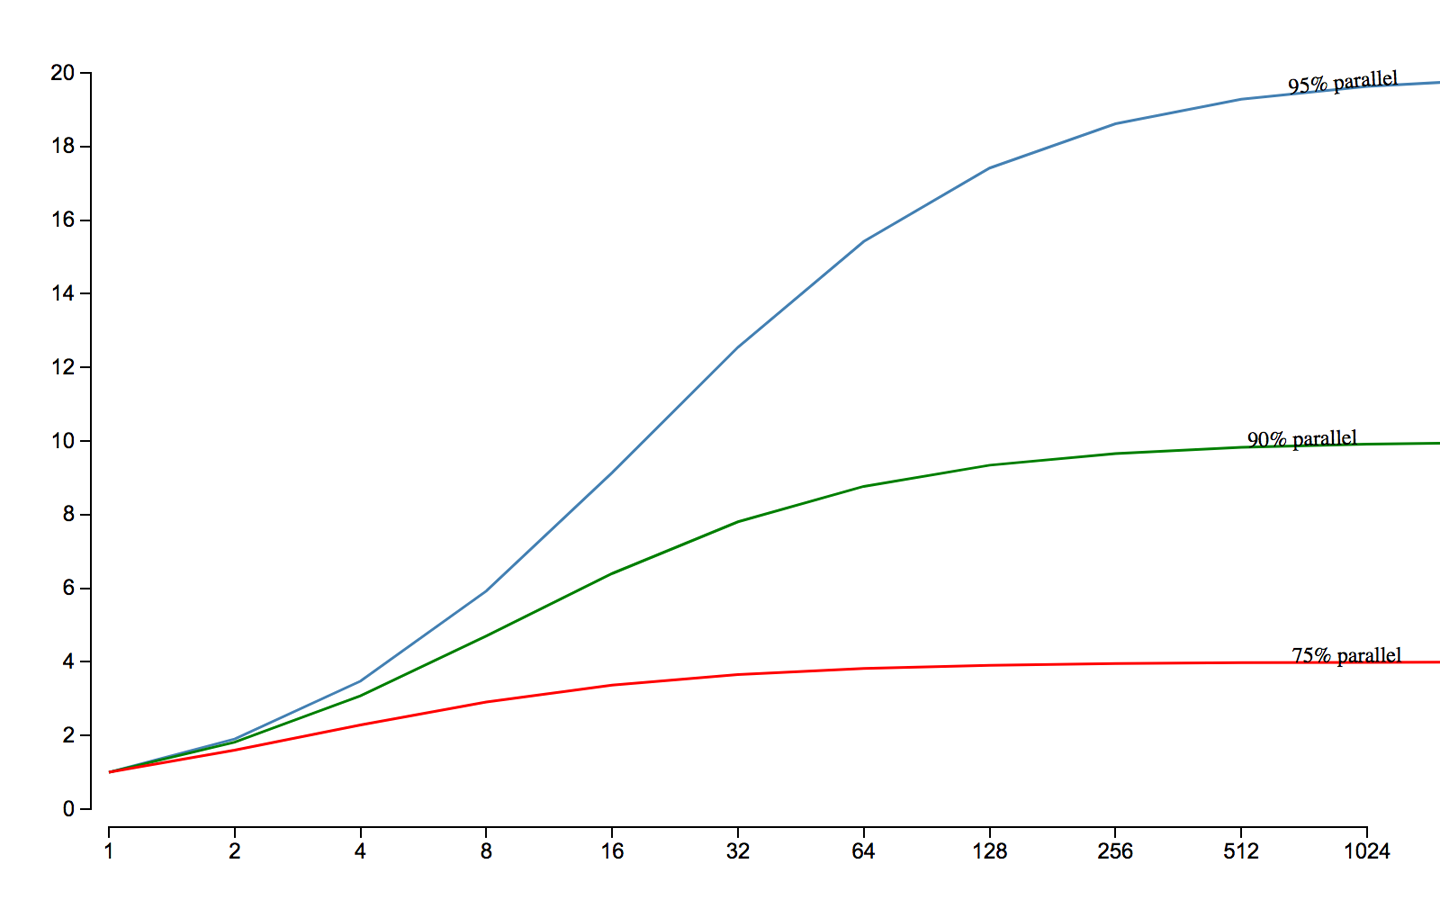
In Chapter 12 we will meet Amdahlâs Law, named for the famous computer scientist (and âfather of the mainframeâ) Gene Amdahl of IBM. Figure 1-3 shows a graphical representation of his fundamental constraint on scalability; it shows the maximum possible speedup as a function of the number of processors devoted to the task.

Figure 1-3. Amdahlâs Law
We display three cases: where the underlying task is 75%, 90%, and 95% parallelizable. This clearly shows that whenever the workload has any piece at all that must be performed serially, linear scalability is impossible, and there are strict limits on how much scalability can be achieved. This justifies the commentary around Figure 1-2âeven in the best cases linear scalability is all but impossible to achieve.
The limits imposed by Amdahlâs Law are surprisingly restrictive. Note in particular that the x-axis of the graph is logarithmic, and so even with an algorithm that is (only) 5% serial, 32 processors are needed for a factor-of-12 speedup. Even worse, no matter how many cores are used, the maximum speedup is only a factor of 20 for that algorithm. In practice, many algorithms are far more than 5% serial, and so have a more constrained maximum possible speedup.
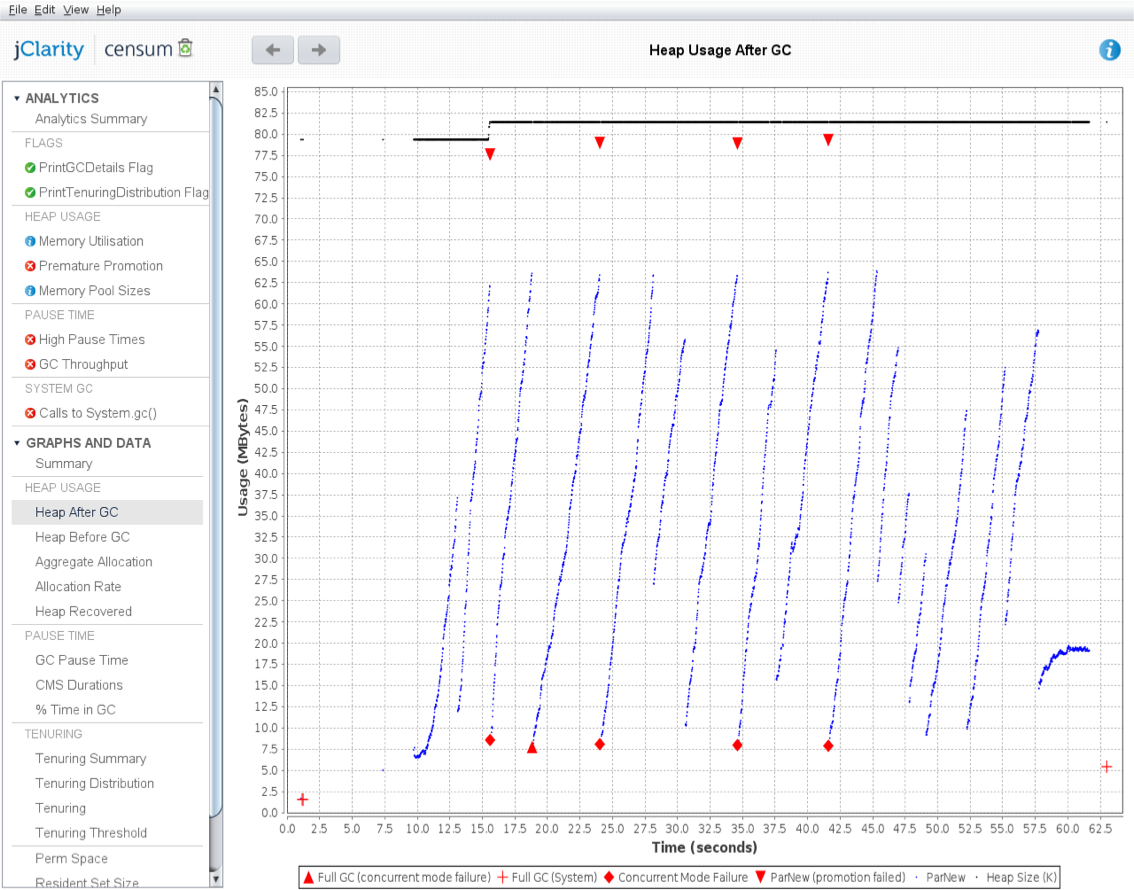
As we will see in Chapter 6, the underlying technology in the JVMâs garbage collection subsystem naturally gives rise to a âsawtoothâ pattern of memory used for healthy applications that arenât under stress. We can see an example in Figure 1-4.

Figure 1-4. Healthy memory usage
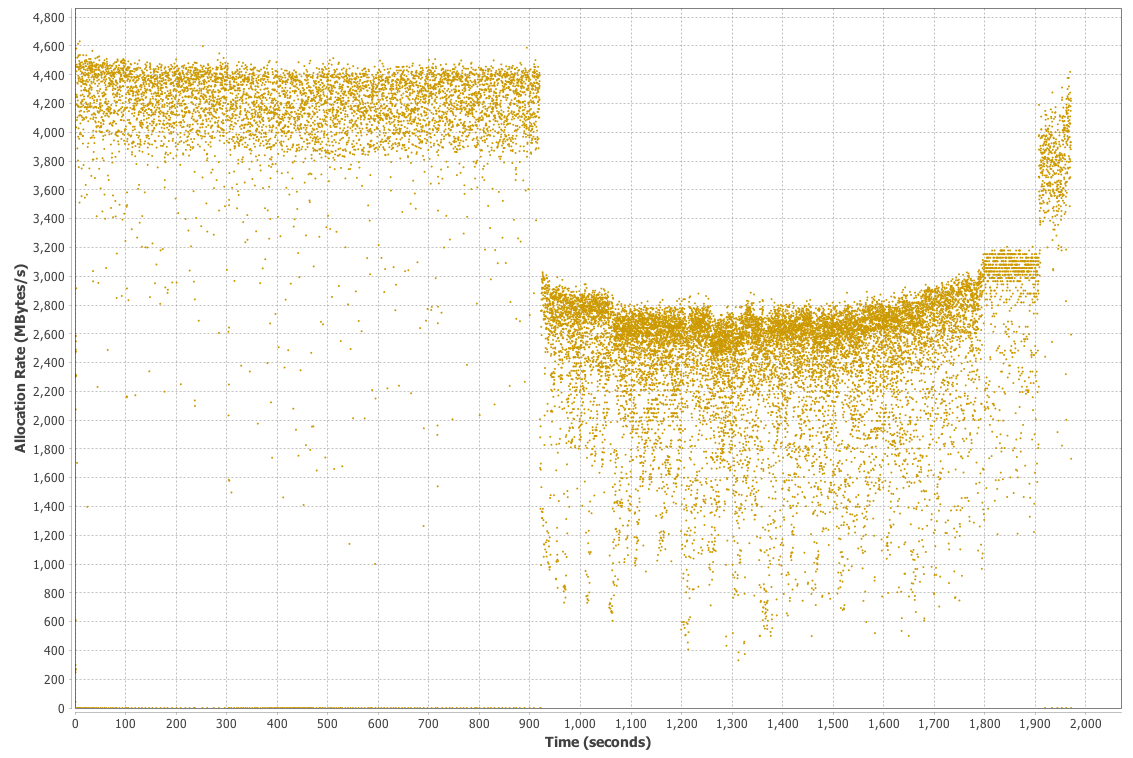
In Figure 1-5, we show another memory graph that can be of great importance when performance tuning an applicationâs memory allocation rate. This short example shows a sample application (calculating Fibonnaci numbers). It clearly displays a sharp drop in the allocation rate at around the 90 second mark.
Other graphs from the same tool (jClarity Censum) show that the application starts to suffer from major garbage collection problems at this time, and so the application is unable to allocate sufficient memory due to CPU contention from the garbage collection threads.
We can also spot that the allocation subsystem is running hotâallocating over 4 GB per second. This is well above the recommended maximum capacity of most modern systems (including server class hardware). We will have much more to say about the subject of allocation when we discuss garbage collection in Chapter 6.

Figure 1-5. Sample problematic allocation rate
In the case where a system has a resource leak, it is far more common for it to manifest in a manner like that shown in Figure 1-6, where an observable (in this case latency) slowly degrades as the load is ramped up, before hitting an inflection point where the system rapidly degrades.

Figure 1-6. Degrading latency under higher load
Summary
In this chapter we have started to discuss what Java performance is and is not. We have introduced the fundamental topics of empirical science and measurement, and the basic vocabulary and observables that a good performance exercise will use. Finally, we have introduced some common cases that are often seen within the results obtained from performance tests. Letâs move on and begin our discussion of some of the major aspects of the JVM, and set the scene for understanding what makes JVM-based performance optimization a particularly complex problem.
Get Optimizing Java now with the O’Reilly learning platform.
O’Reilly members experience books, live events, courses curated by job role, and more from O’Reilly and nearly 200 top publishers.

