June 2013
Intermediate to advanced
440 pages
16h 14m
English
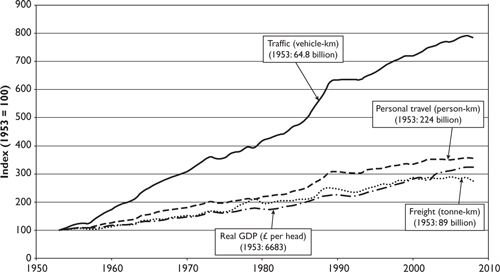
Figure 4.1 shows the increases over the past half-century in passenger movement (measured in person-kilometres), the movement of freight (measured in tonne-kilometres) and road traffic (measured in vehicle-kilometres). It also shows the improvement in the average standard of living (measured in real gross domestic product (GDP) (£) per head), at once both the cause and the effect of the rise in traffic and transport. The data are portrayed in the form of ‘indices’,1 since this enables the trends to be compared despite the different units of measurement.