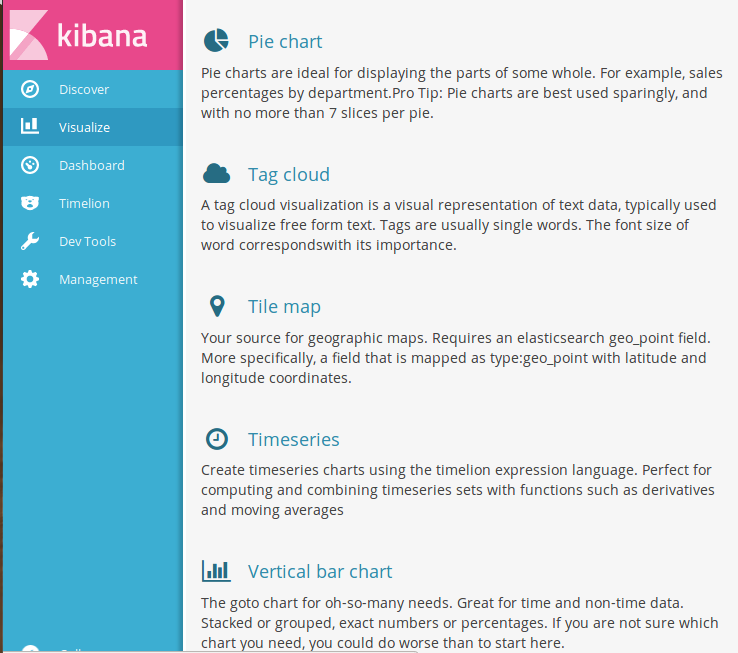
Build a dashboard with different visualizations available. First you have to add the indexes by clicking on Management and then index patterns. Add vehicle-alert and vehicle-tdr as indexes in Kibana for visualization. Once you click on Visualize the available options are displayed, as shown in the following screenshot:

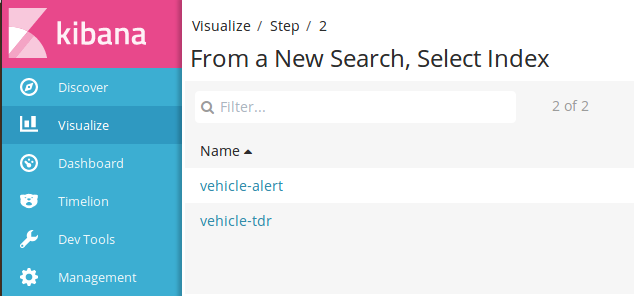
When you select any type of visualization then Kibana asks you to select the index name first, as shown in the following screenshot:

Now, add visualizations as per your need. A few of the examples: ...

