Chapter 4. Evaluating Synthetic Data Utility
To achieve widespread use and adoption, synthetic data needs to have sufficient utility to produce analysis results similar to the original data’s.1 This is the trust-building exercise that was discussed in Chapter 1. If we know precisely how the synthetic data is going to be used, we can synthesize the data to have high utility for that purpose—for example, if the specific type of statistical analysis or regression model that will be performed on the synthetic data is known. However, in practice, synthesizers will often not know a priori all of the analyses that will be performed with the synthetic data. The synthetic data needs to have high utility for a broad range of possible uses.
This chapter outlines a data utility framework that can be used for synthetic data. A common data utility framework would be beneficial because it would allow for the following:
-
Data synthesizers to optimize their generation methods to achieve high data utility
-
Different data synthesis approaches to be consistently compared by users choosing among data synthesis methods
-
Data users to quickly understand how reliable the results from the synthetic data would be
There are three types of approaches to assess the utility of synthetic data that have been used:
-
Workload-aware evaluations
-
Generic data utility metrics
-
Subjective assessments of data utility
Workload-aware metrics look at specific feasible analyses that would be performed on the data and compare the results or specific parameters from the real and the synthetic data.2 These analyses can vary from simple descriptive statistics to more complex multivariate models. Typically an analysis that was done or was planned on the real data is replicated on the synthetic data.
Generic assessments would consider, for example, the distance between the original and transformed data.3 These often do not reflect the very specific analysis that will be performed on the data but rather provide broadly useful utility indicators when future analysis plans are unknown. To interpret generic metrics, they need to be bounded (e.g., from 0 to 1), and there should be some accepted yardsticks for deciding whether a value is high enough or too low.
A subjective evaluation would get a large enough number of domain experts who would look at a random mix of real and synthetic records and then attempt to classify each as real or synthetic. If a record looks realistic enough, then it would be classified as real, and if it has unexpected patterns or relationships, then it may be classified as synthetic. For example, for a health dataset, clinicians may be asked to perform the subjective classification. The accuracy of that classification would then be evaluated.
In the next few sections we present a hybrid framework for evaluating the utility of synthetic data by considering some workload-aware metrics as well as some generic metrics covering possible univariate, bivariate, and multivariate models that would be constructed from the data. We do not illustrate a subjective evaluation.
In addition to replicating an analysis performed on a real dataset, our metrics are generic in that exact knowledge of the desired analysis is not required, and they are workload-aware in that they consider many likely simple and complex models that would be developed in practice.
Synthetic Data Utility Framework: Replication of Analysis
We use the census data from the UC Irvine machine learning repository to illustrate the replication of an analysis. This dataset has 48,842 records, with the variables summarized in Figure 4-1.
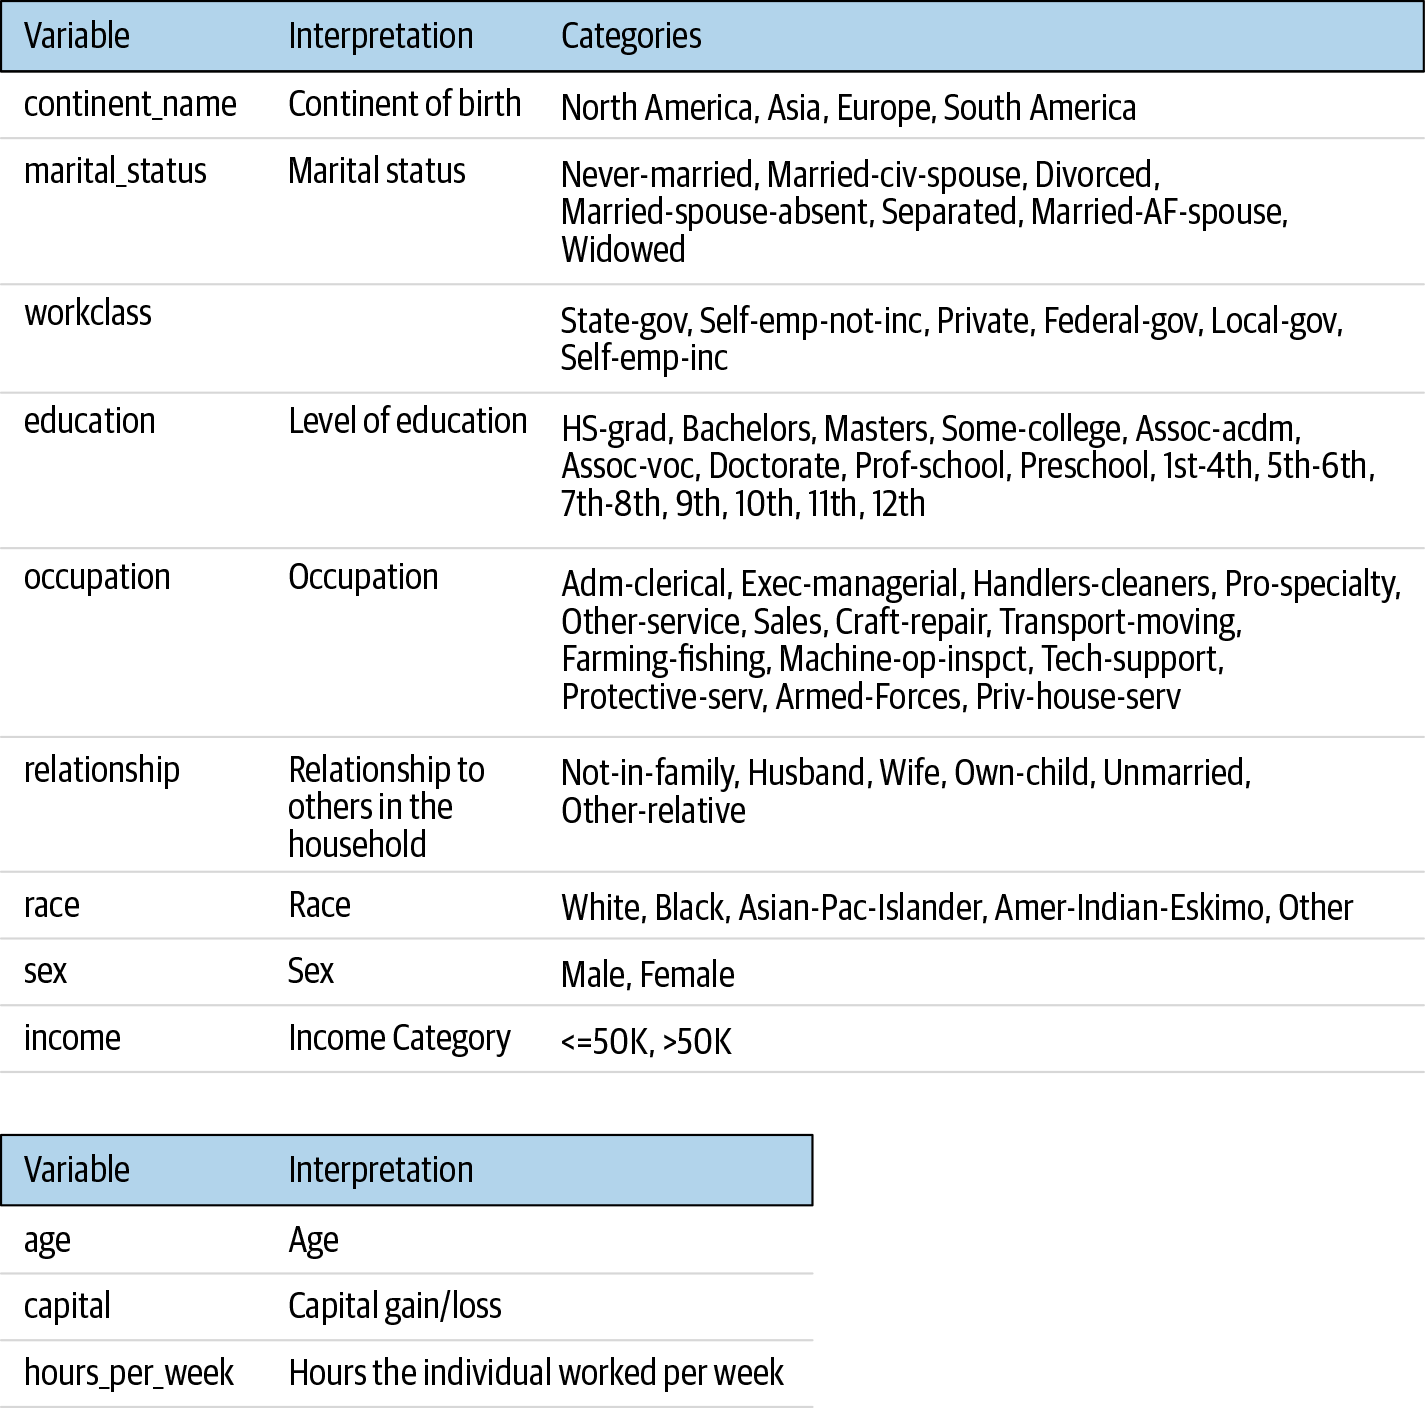
Figure 4-1. The variables that we use in the census dataset. The top table contains the categorical variables and their valid values, and the bottom table contains the continuous variables.
We built a classification tree to classify the income variable, which has two categories. All of the other variables were used as predictors. This is a typical analysis that is performed on this dataset. The tree-building exercise used 10-fold cross-validation.
The resulting tree on the real dataset is shown in Figure 4-2. The tree built from the synthetic data was exactly the same, and therefore we will not repeat it here.
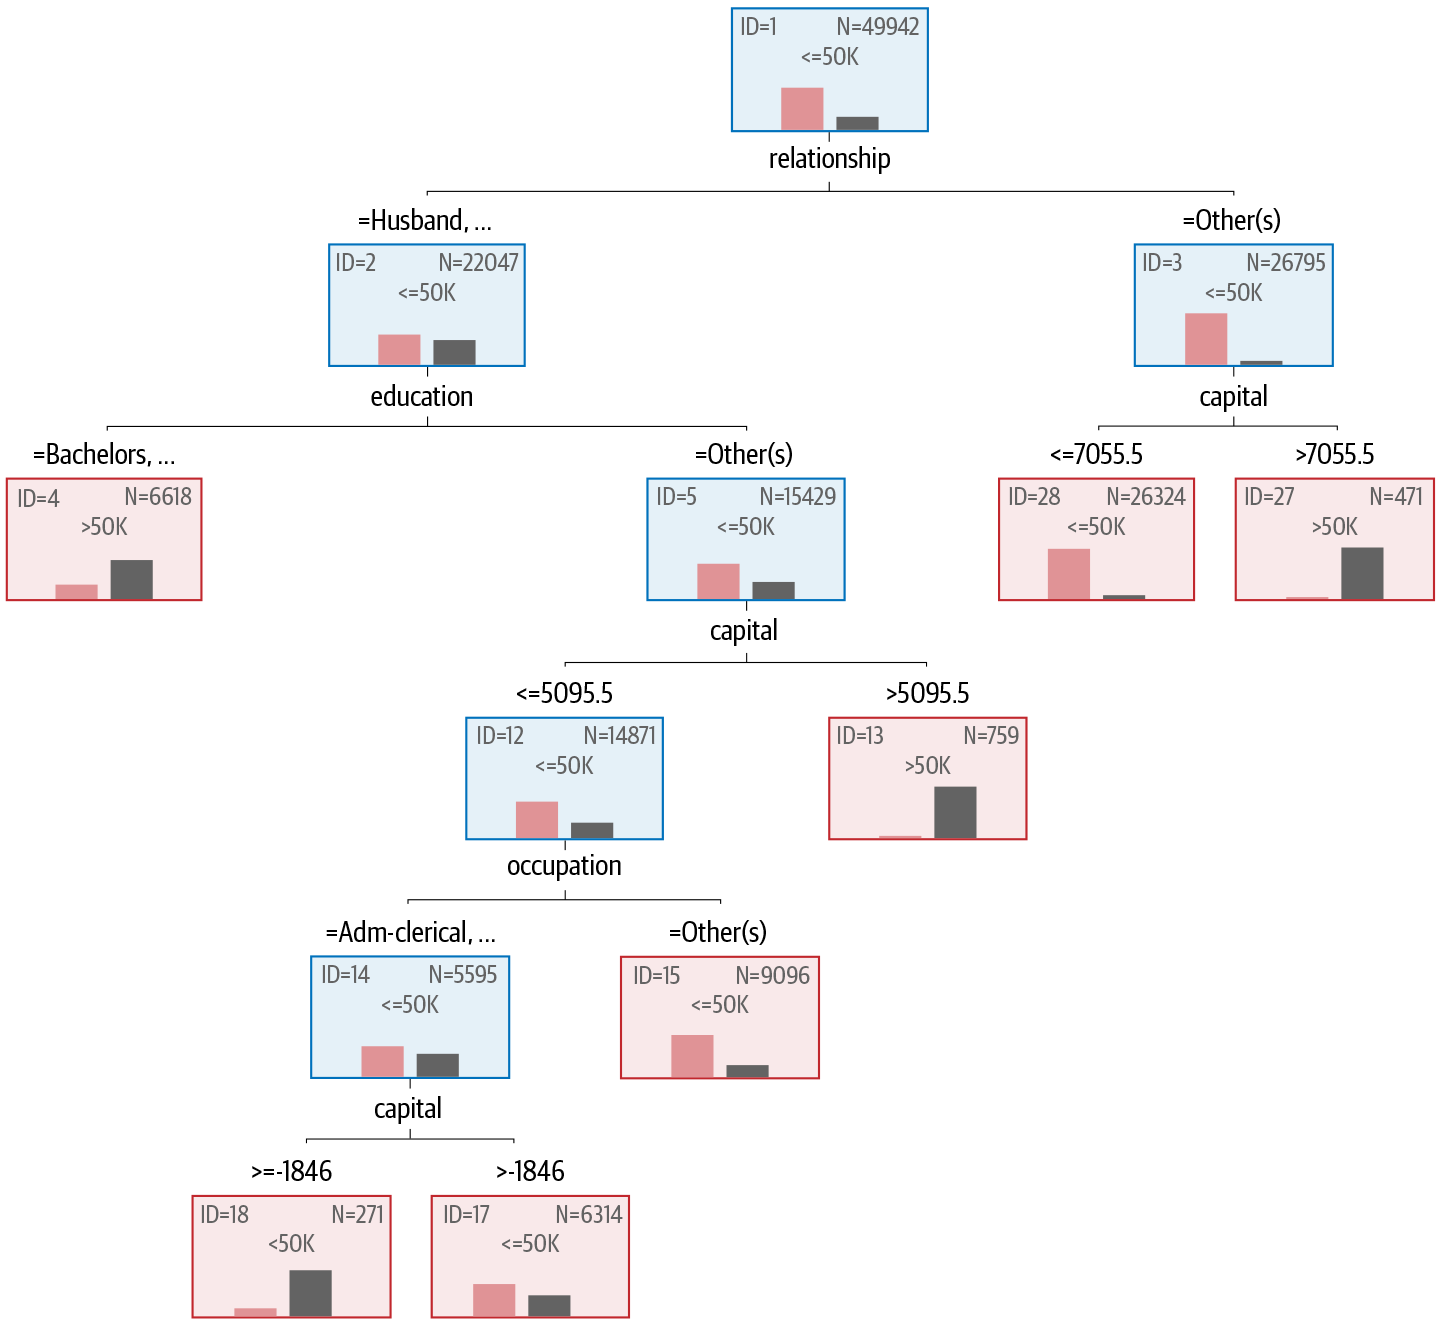
Figure 4-2. The classification tree developed from the census dataset to predict the income class
The first split in the tree is based on the relationship variable. If the relationship is husband or wife, then we go to node number 2; otherwise, we go to node number 3. In node 3 the split is based on capital gains of just over $7,000.00. Therefore, those who are not husbands or wives and have capital gains over $7,055.50 will tend to have an income greater than $50K.
In node 2 there is another split. Here, those husbands or wives who have a bachelor’s, a master’s, a doctorate, or who went to a professional school also have an income greater than $50K. Otherwise, those with less education go to node 5, which splits on capital again. And so on as we navigate through the tree.
The importance of the variables in the real and synthetic datasets is shown in Figure 4-3. This reflects each variable’s contributions to the classification of income. As can be seen, the variable importance is exactly the same in models from both types of datasets.
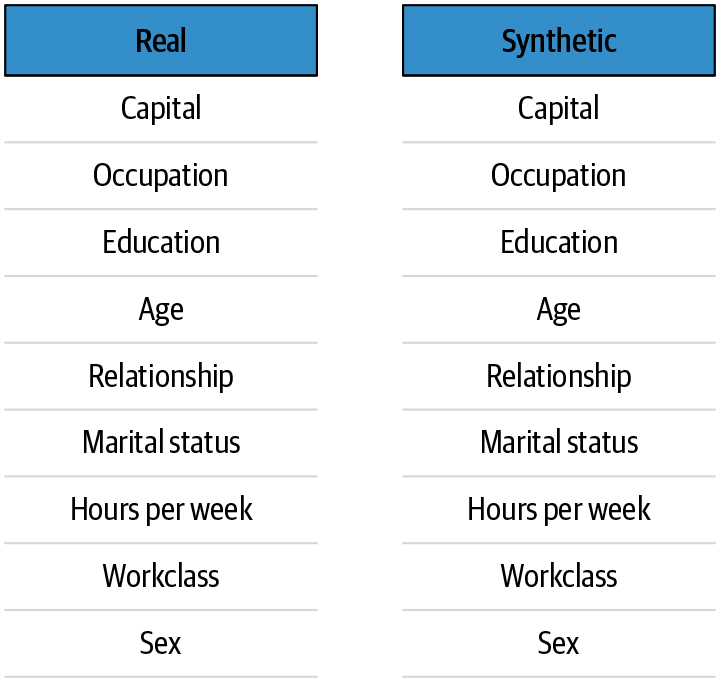
Figure 4-3. The importance of the variables in terms of their contribution to the classification of income
We can see from this replication of analysis that the real and synthetic data generated the same classification tree. That is a meaningful test of whether a synthetic dataset has sufficient utility. If the same results can be obtained from real and synthetic data, then the synthetic data can serve as a proxy.
However, it is not always possible to perform the same analysis as the real data. For example, the original analysis may be very complex or labor-intensive, and it would not be cost-effective to replicate it. Or an analysis on the real dataset may not have been performed on the original data yet; therefore, there is nothing to compare against. In such a case, more general-purpose metrics are needed to evaluate the utility of the data, which is the topic we turn to next.
Synthetic Data Utility Framework: Utility Metrics
Different types of analyses that may be performed on a synthetic dataset and the distinguishability of the synthetic dataset from the original dataset are the basis of our data utility framework. We use the clinical trial datasets described in “Example Clinical Trial Data” to illustrate the various techniques.
To generate each synthetic clinical trial dataset, a model was built from the real data and then the synthetic data was sampled from that model. Specifically, a form of classification and regression tree (CART)4 called a conditional inference tree was used to generate the synthetic data.5 The main advantage of this method is that it can capture the structure of the data by finding interactions and nonlinear relationships in a data-driven way, addressing variable selection biases and handling missing data in an unbiased manner.
Comparing Univariate Distributions
This type of comparison between real and synthetic data indicates whether the variable distributions are similar.
Let’s look at the example in Figure 4-4. Here we have the original age variable and the synthesized age variable for one of the clinical trial datasets we have been looking at. The synthesized age distribution is quite similar to the original age distribution, and therefore the data utility here is expected to be high. We do not want the distribution to be exactly the same because that could be an indicator of a privacy problem.
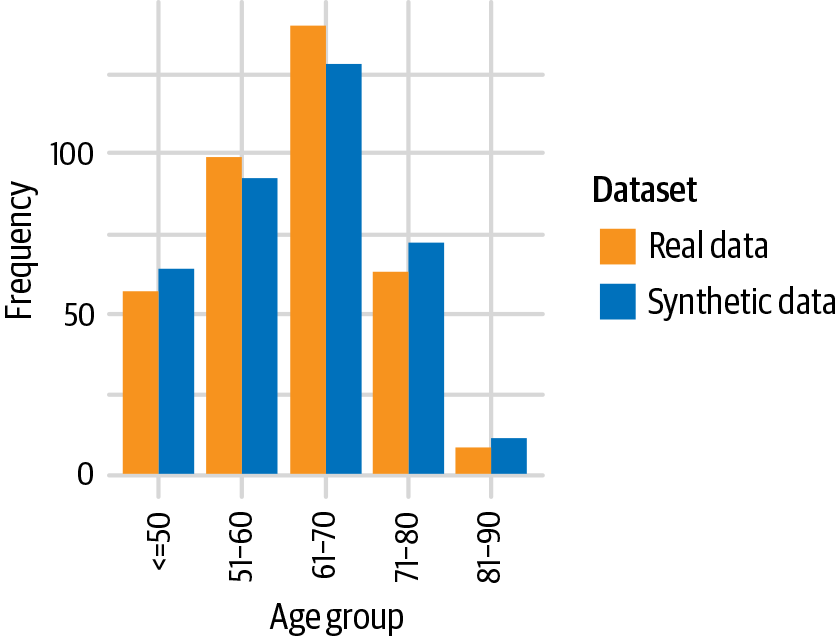
Figure 4-4. A comparison of real and synthetic distributions on age when the distributions are similar
It is informative to look at some examples in which there are differences between the real and synthetic distributions.
When data synthesis methods do not work well (for example, poorly fitted models), we get something like the examples in Figure 4-5 for clinical trial height data and in Figure 4-6 for clinical trial weight data. In these examples you can clearly see the mismatch between the original distributions and the generated distributions. It does not look like the synthesized data took much of the real data into account during the generation process! We don’t want that outcome, of course. However, one of the first things to look at in the synthetic data is how well the distributions match the original data.
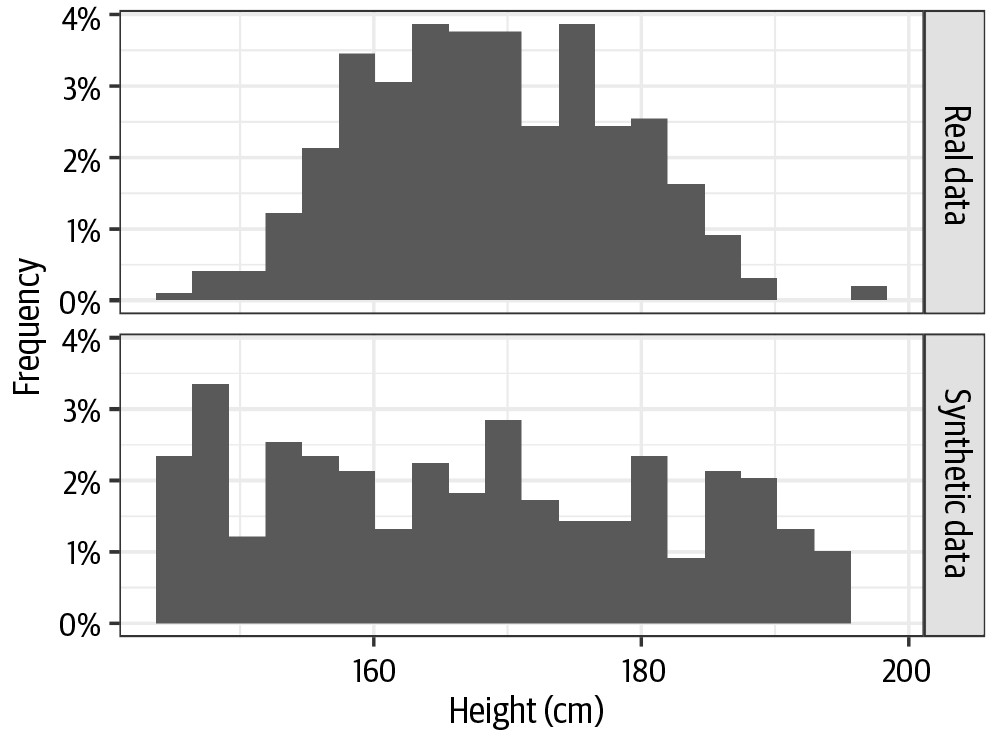
Figure 4-5. A comparison of real height data from a clinical trial and the synthesized version when the data synthesis did not work well
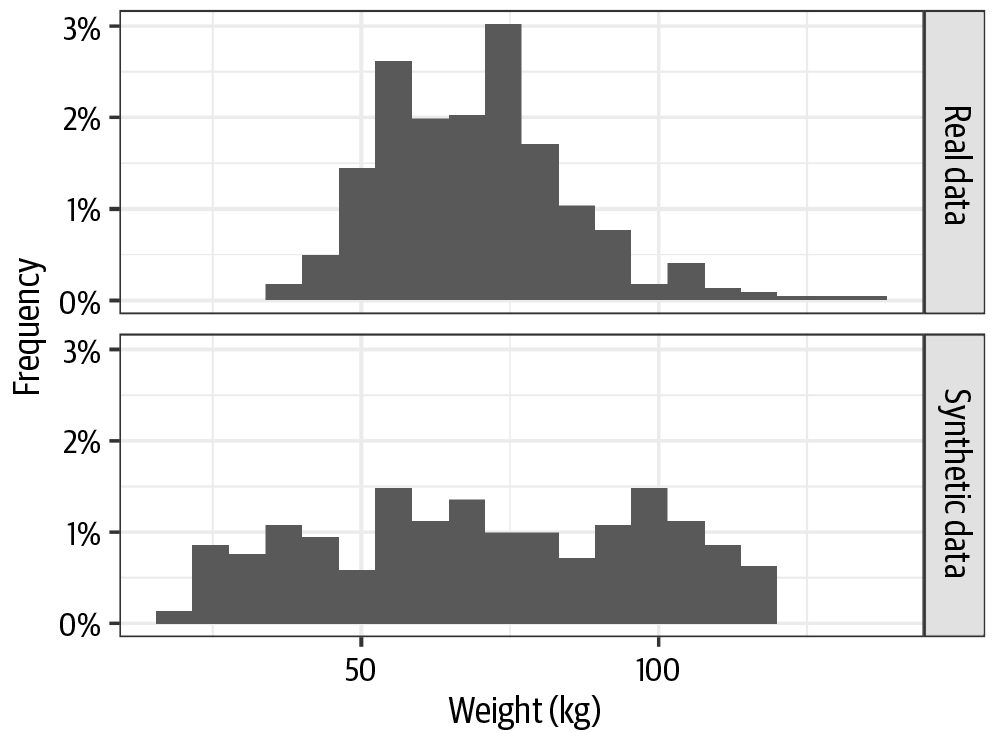
Figure 4-6. A comparison of real weight data from a clinical trial and the synthesized version when the data synthesis did not work well
In practice, there will be many variables in a dataset, and we want to be able to compare the real and synthetic distributions for all of them in a concise way. It is not practical to generate two histograms for every variable and visually compare them to decide if they are close enough or not: that is just not scalable and the reliability will not always be high (two analysts may assess the similarity of two distributions inconsistently). Therefore, we need some sort of summary statistic.
The Hellinger distance can be calculated to measure the difference in distribution between each variable in the real and synthetic data. The Hellinger distance is a probabilistic measure between 0 and 1, where 0 indicates no difference between distributions. It has been shown to behave in a manner consistent with other distribution comparison metrics when comparing original and transformed data (to protect data privacy).6
One important advantage of the Hellinger distance is that it is bounded, and that makes it easier to interpret. If the difference is close to 0, then we know that the distributions are similar, and if it is close to 1, then we know that they are very different. It can also be used to compare the univariate data utility for different data synthesis approaches. And another advantage is that it can be computed for continuous and categorical variables.
When we have many variables we can represent the Hellinger distances in a box-and-whisker plot, which shows the median and the inter-quartile range (IQR). This gives a good summary view of how similar the univariate distributions are between the real and synthetic data. The box-and-whisker plot shows the box bounded by the 75th and 25th percentiles, and the median is a line in the middle.
For a high-utility synthetic dataset, we expect the median Hellinger distance across all variables to be close to 0 and the variation to be small, indicating that the synthetic data replicates the distribution of each variable in the real data accurately.
Figure 4-7 summarizes the differences between the univariate distributions of the synthetic data relative to the real data for the first trial. The median Hellinger distance was 0.01 (IQR = 0.02), indicating that the distributions of real and synthetic variables were nearly identical. Figure 4-8 summarizes the differences in the univariate distribution of the synthetic data relative to the real data for the second trial. The median Hellinger distance was 0.02 (IQR = 0.03), also indicating that the real and synthetic variables were nearly identical in distribution.
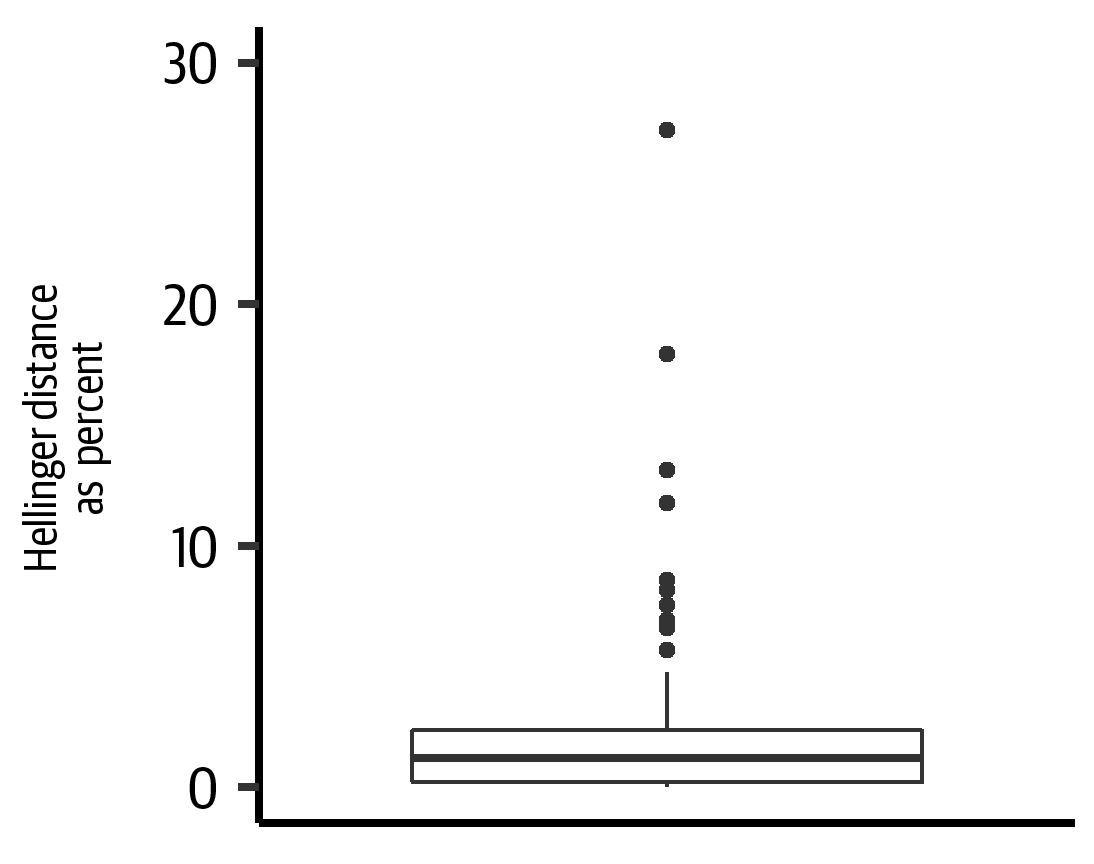
Figure 4-7. The Hellinger distance as percent for all variables in the dataset. This indicates how similar the univariate distributions are between the real and the synthetic data for the first trial.
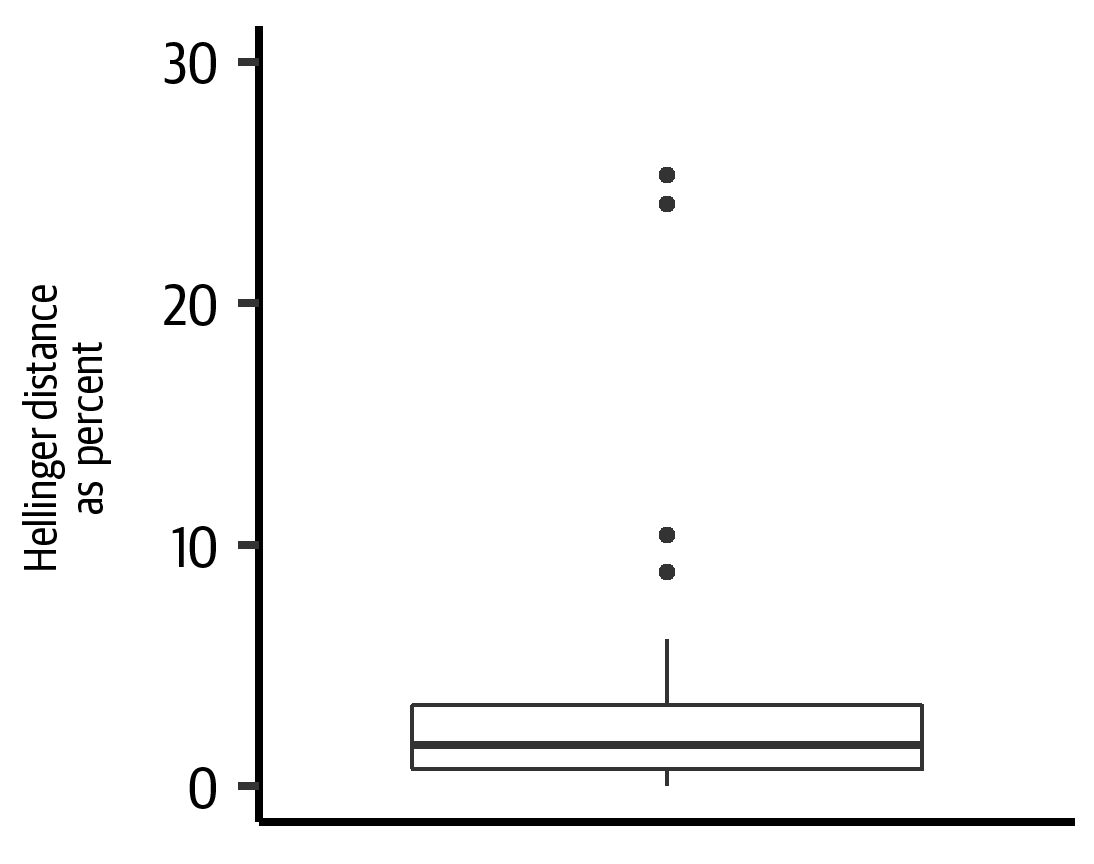
Figure 4-8. The Hellinger distance as percent for all variables in the dataset. This indicates how similar the univariate distributions are between the real and the synthetic data for the second trial.
Comparing Bivariate Statistics
Computing differences between correlations in the real and synthetic data is a commonly used approach for evaluating the utility of synthetic data.7 In such a case, the absolute difference in correlations between all variable pairs in the real and synthetic data can be computed as a measure of data utility. We would want the correlations to be very similar between the two datasets.
The type of correlation coefficient will depend on the types of variables. For example, a different coefficient is needed for a correlation between two continuous variables versus a correlation between a binary variable and a categorical variable.
For relationships between continuous variables, Pearson correlation coefficients can be used. For correlation between continuous and nominal variables, the multiple correlation coefficient can be used, while for continuous and dichotomous variables, point-biserial correlation is used. If one of the variables is nominal and the other is nominal or dichotomous, Cramér’s V can be used. Lastly, if both variables are dichotomous, the phi coefficient can be calculated to quantify correlation.
The absolute difference in bivariate correlations should then be scaled as necessary to ensure all difference values are bounded by 0 and 1. For a high-utility synthetic dataset, we would expect that the median absolute differences in these correlation measures calculated on the real data and on the synthetic data would be close to 0.
Again, to represent the utility in a concise manner, we can plot the absolute difference in correlations on a box-and-whisker plot across all possible pairwise relationships or we can represent these as a heat map. A heat map shows the difference value in shades to illustrate which bivariate correlation differences are big versus small.
Examining the difference in bivariate correlations for the first trial in Figure 4-9, the median absolute difference in the correlation observed in the real data compared to the correlation observed in the synthetic data was 0.03 (IQR = 0.04). In Figure 4-10, we have the results for the second trial, where the median absolute difference in the correlation observed in the synthetic data compared to the correlation observed in the real data was 0.03 (IQR = 0.04). This indicates that the bivariate relationships in the data have been broadly preserved during the synthetic data generation process.
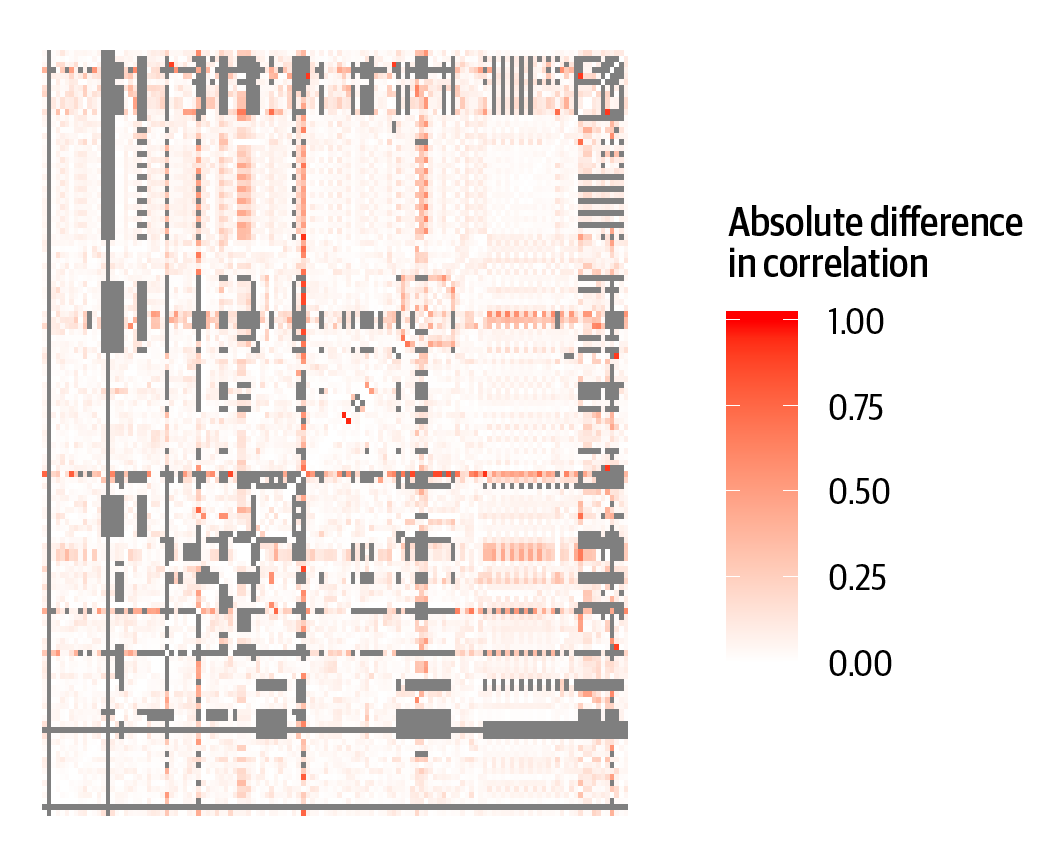
Figure 4-9. Absolute differences in bivariate correlations between the real and synthetic data for the first trial. Lighter shades indicate that the differences were close to 0, while gray corresponds to where correlation could not be computed due to missing values or low variability.
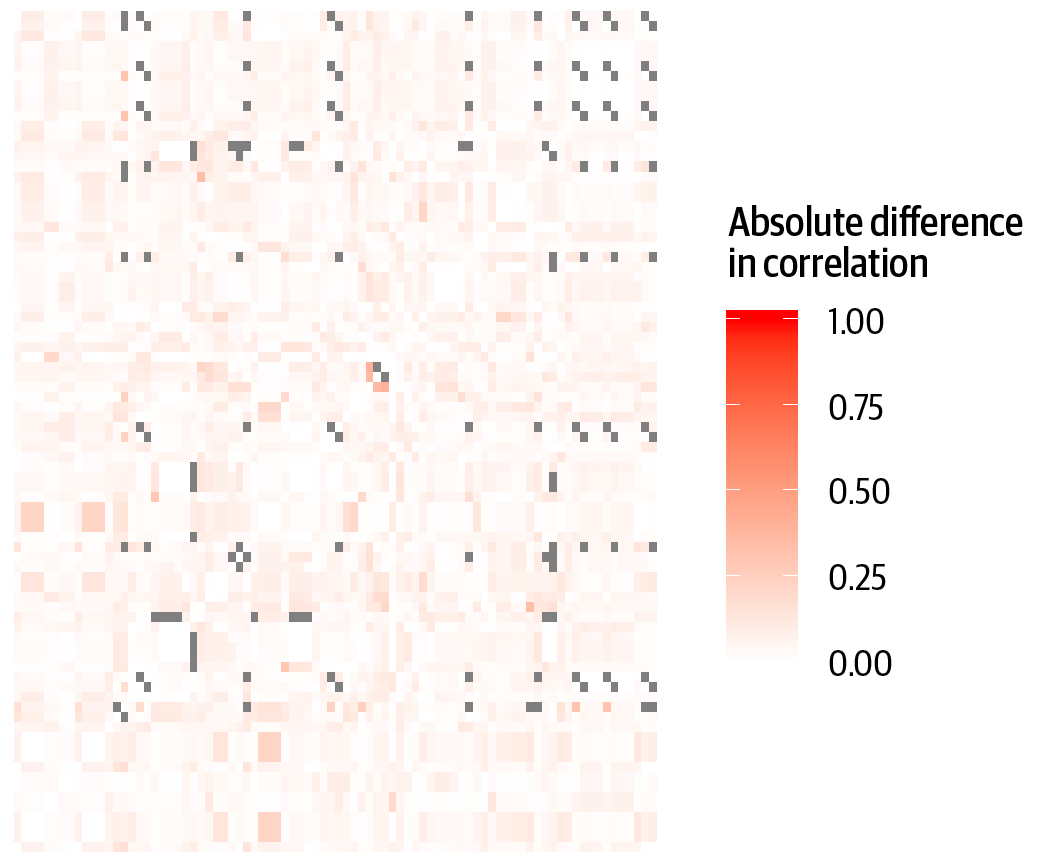
Figure 4-10. Absolute differences in bivariate correlations between the real and synthetic data for the second trial. Lighter shades indicate that the differences were close to 0, while gray corresponds to where correlation could not be computed due to missing values or low variability.
The box-and-whisker graphs for these differences are shown in Figures 4-11 and 4-12. These are more informative than the heat maps, although keep in mind that the box-and-whisker plots are summarizing thousands of bivariate correlations for every one of these datasets. For example, for the second trial there are 6,916 correlations actually computed from 7,056 possible correlations.
The outliers in this plot are the circles above the top whisker. In these datasets they occur because rare observations in the data can affect the correlation coefficients, or because some variables have many missing values which makes the correlation coefficients unstable. In general, we aim for a small median and consider all of the utility metrics together.
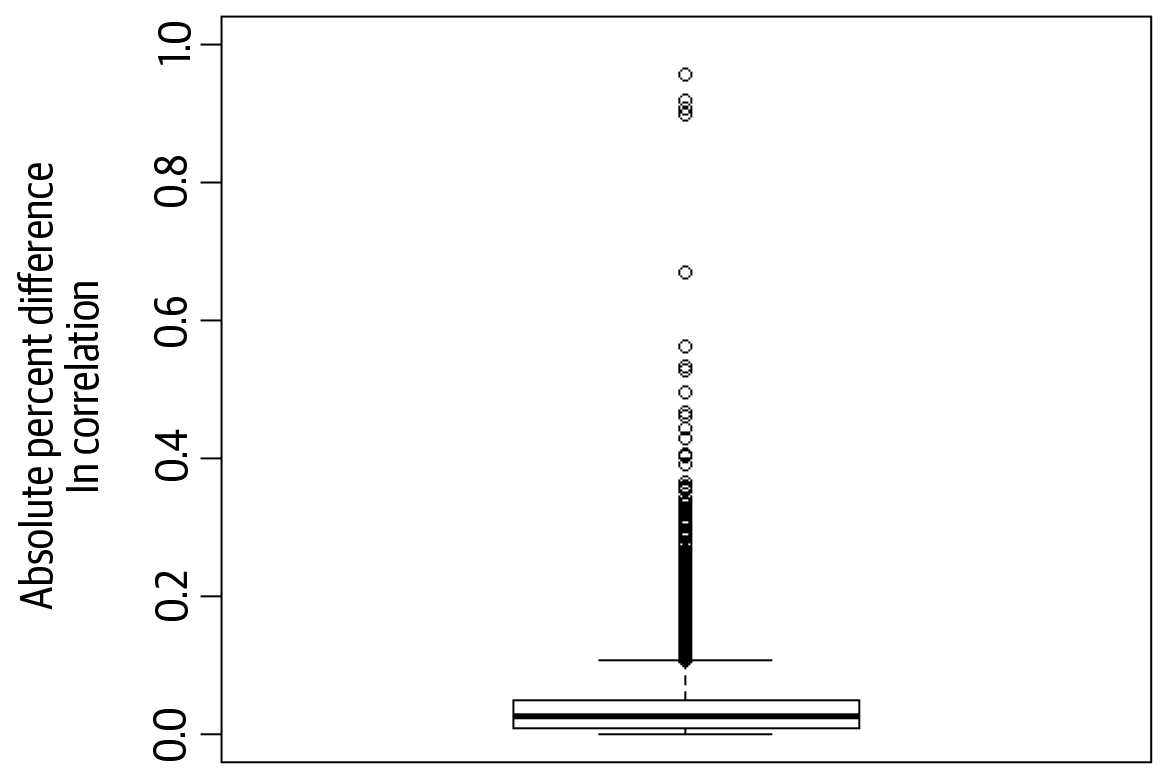
Figure 4-11. Absolute differences in bivariate correlations between the real and synthetic data for the first trial. The box-and-whisker plot illustrates the median and distributions clearly.
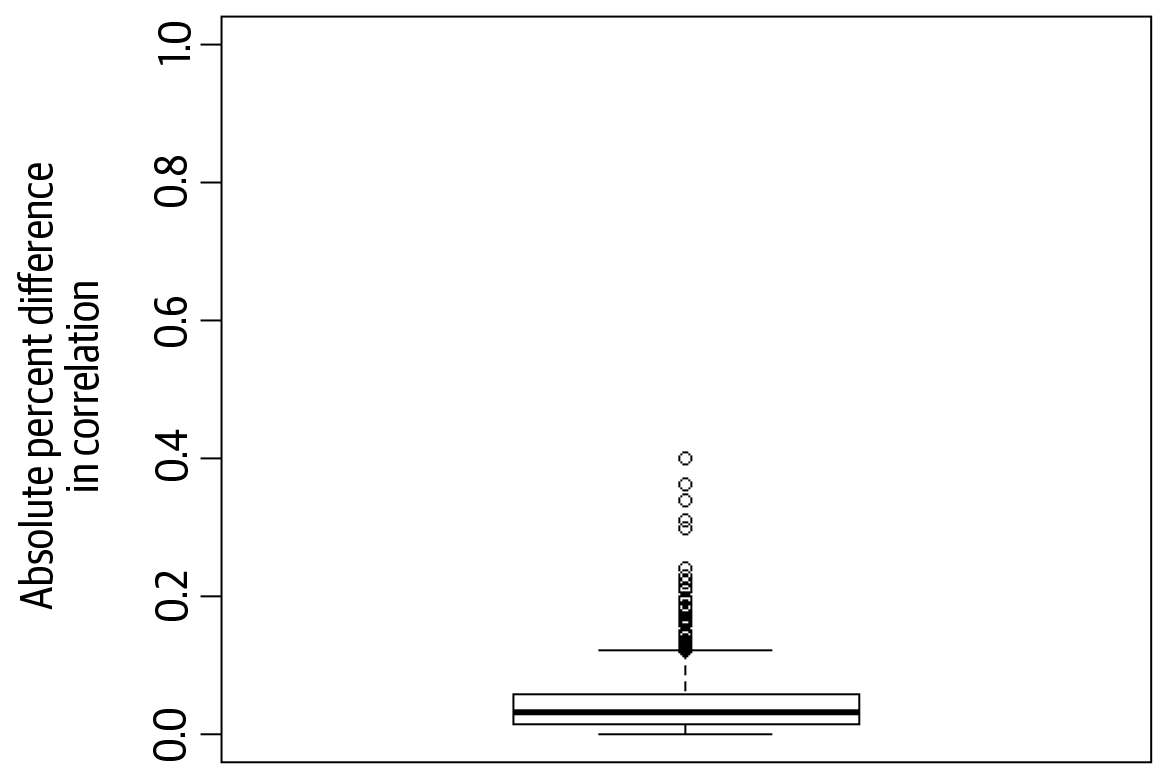
Figure 4-12. Absolute differences in bivariate correlations between the real and synthetic data for the second trial. The box-and-whisker plot illustrates the median and distributions clearly.
Comparing Multivariate Prediction Models
To determine whether the real and synthetic data have similar predictive ability using multivariate models, we can build classification models with every variable in the dataset as an outcome. Since it is not known a priori what an actual analyst would want to do with the dataset, we examine all possible models. This is called the all models test.
Generalized boosted models (GBM) can be used to build classification trees. These can produce quite accurate prediction models in practice.
We needed to compute the accuracy of the models that we built. To do that, we used the area under the receiver operating characteristics curve (known as the AUROC; see “A Description of ROCs”).8 The AUROC is a standardized way to evaluate prediction model accuracy. To compute the AUROC we used 10-fold cross-validation. This is when we split the dataset into multiple training and testing subsets.
Let’s describe 10-fold cross-validation briefly. We take a dataset and split it into 10 equally sized subsets numbered (1) to (10). We first keep subset (1) as a test set and build a model with the remaining nine subsets. We then test the model on the subset (1) that we took out. We compute the AUROC on that test set. We then put subset (1) back in as part of the training data and take subset (2) out and use it for testing, and we compute AUROC for that. The process is repeated 10 times, each time taking one of the subsets out and using it for testing. At the end we have 10 values for AUROC. We take the average of these to compute the overall AUROC.
This average AUROC was computed for every model we built on the synthetic data and its counterpart on the real data (the counterpart being a model with the same outcome variable). The absolute difference between the two AUROC values was computed. A box-and-whisker plot was then generated from all of these absolute differences in the AUROC values.
To ensure that all of the models can be summarized in a consistent way, continuous outcome variables can be discretized to build the classification models. We used univariate k-means clustering, with optimal cluster sizes chosen by the majority rule.9 High-utility synthetic data would have little difference in predictive ability compared to the real data, indicated by the median percent difference in mean AUROC.
Figure 4-15 shows the results of 10-fold cross-validation to assess the predictive accuracy of each GBM for the first trial. The absolute percent difference in the AUROC is near 0 for many variables, with a median of 0.5% (IQR = 3%). This indicates that analysis conducted using the synthetic data instead of the real dataset has very similar predictive ability, and that generally the models trained using synthetic data will produce the same conclusion when applied to real data as models that were trained using real data.
In Figure 4-16 we have a similar result for the second trial. The absolute percent difference in the AUROC has a median of 0.02% (IQR = 1%). This also indicates that the synthetic data has very similar predictive ability to the real data.
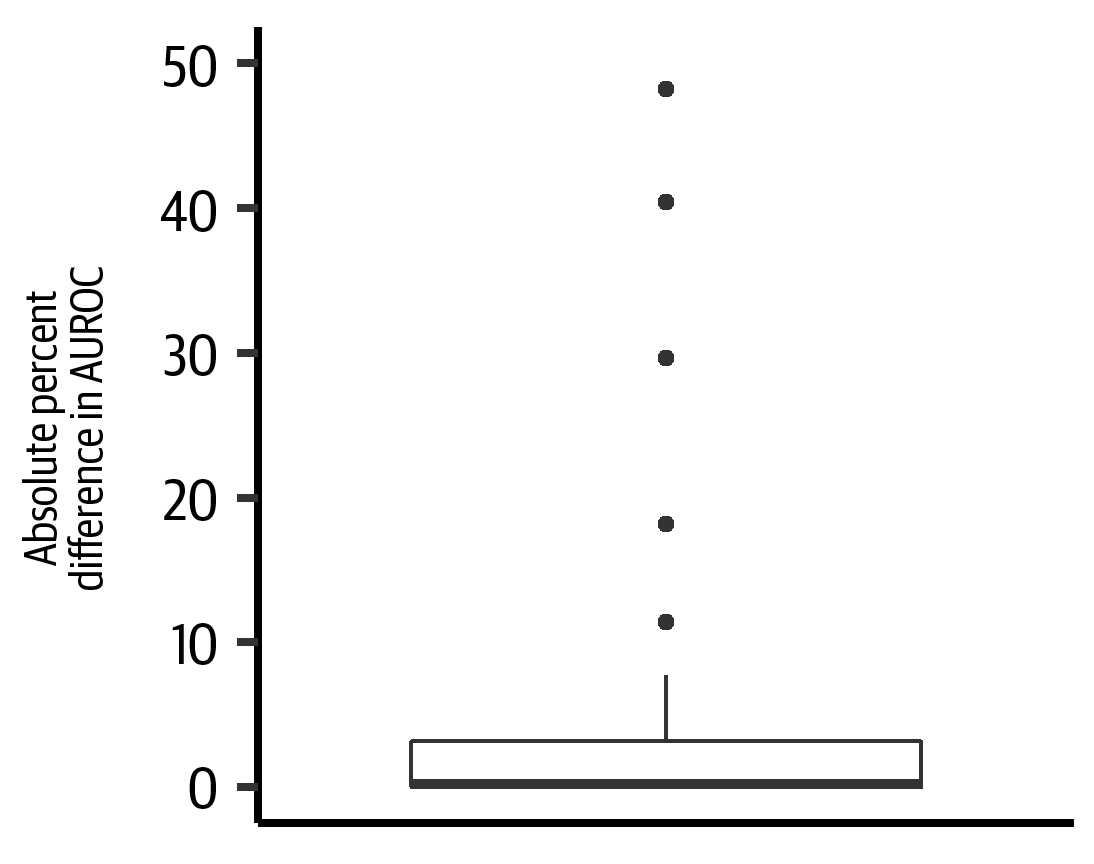
Figure 4-15. Absolute percent difference between the real and synthetic models for the first trial
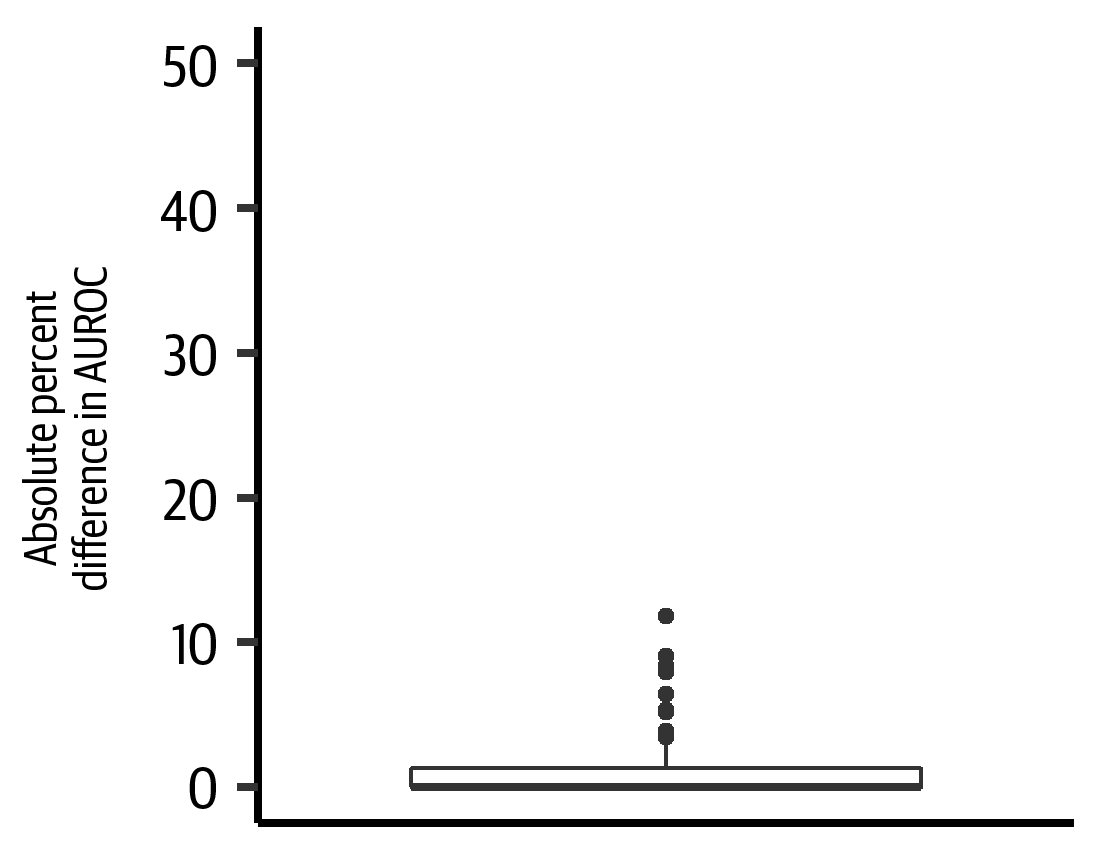
Figure 4-16. Absolute percent difference between the real and synthetic models for the second trial
Another approach, which we will refer to as an external validation of sorts, is as follows:
-
Divide the real data into 10 equally sized random segments.
-
Remove segment one and make it a test set, and generate the synthetic data on the remaining nine segments.
-
Build a GBM using the synthetic data and predict on the test segment from the real data and compute the AUROC.
-
Repeat the process another nine times with each segment taken out as the test set.
-
Once all predictions have been made across the 10 folds, compute the average AUROC.
This multivariate external validation tests whether the synthesized data can generate good predictive models where the goodness is evaluated on the holdout real data.
Distinguishability
Distinguishability is another way to compare real and synthetic data in a multivariate manner. We want to see if we can build a model that can distinguish between real and synthetic records. Therefore, we assign a binary indicator to each record, with a 1 if it is a real record and a 0 if it is a synthetic record (or vice versa). We then build a classification model that discriminates between real and synthetic data. We use this model to predict whether a record is real or synthetic. We can use a 10-fold cross-validation approach to come up with a prediction for each record.
This classifier can output a probability for each prediction. If the probability is closer to 1, then it is predicting that a record is real. If the probability is closer to 0, then it is predicting that a record is synthetic. This is effectively a propensity score for every record.
In health research settings, the propensity score is typically used to balance treatment groups in observational studies when random assignment to the treatment (versus the control) is not possible. It provides a single probabilistic measure that weighs the effect of multiple covariates on the receipt of treatment in these observational studies.10 Using the propensity score as a measure to distinguish between real and synthetic data is becoming a somewhat common practice.11 Propensity scores can be computed quite accurately using generalized boosted models.12
If the two datasets are exactly the same, then there will be no distinguishability between them—this is when the synthetic data generator was overfit and effectively re-created the original data. In such a case the propensity score of every record will be 0.5, in that the classifier is not able to distinguish between real and synthetic data. This is illustrated in Figure 4-17. In the same manner, if the label of “real” versus “synthetic” is assigned to the records completely at random, then the classifier will not be able to distinguish between them. In such a case the propensity score will also be 0.5.
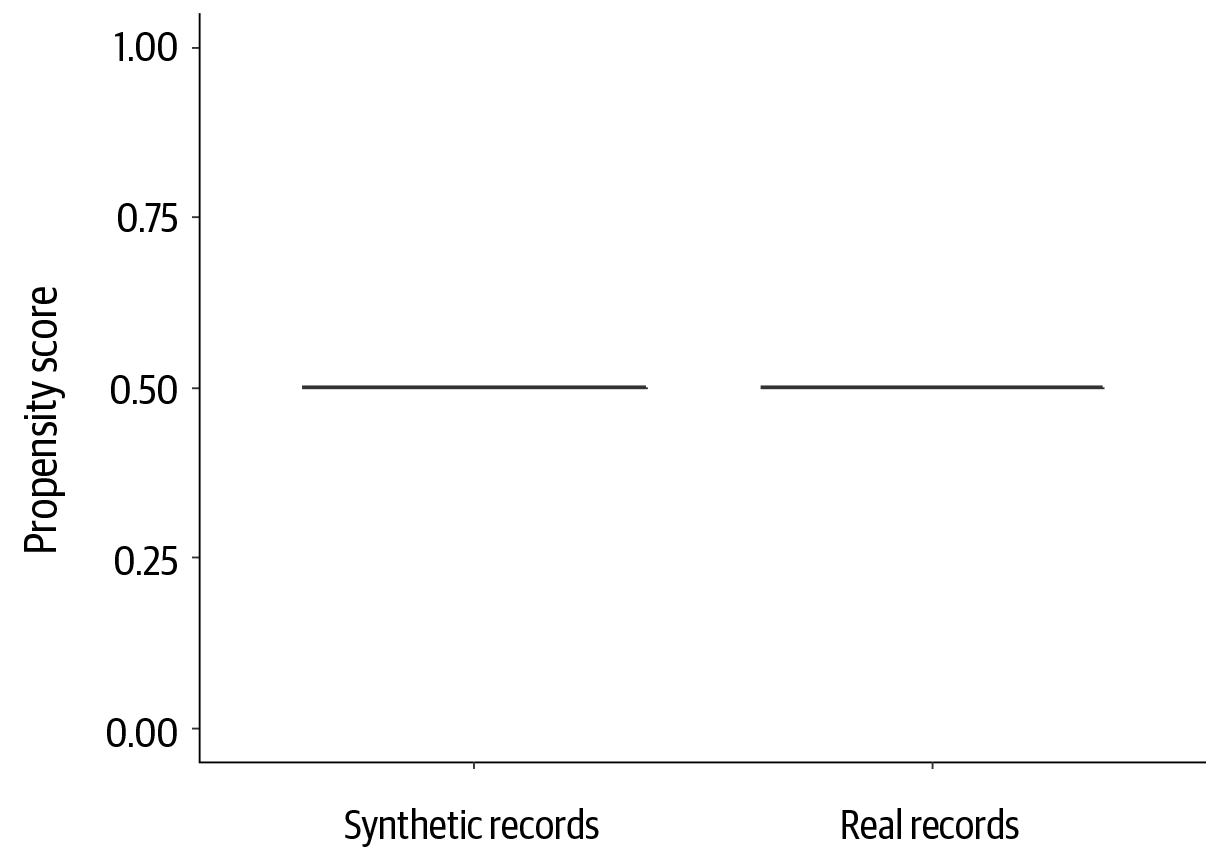
Figure 4-17. An example of distinguishability using propensity scores when there is no difference between real and synthetic data
If the two datasets are completely different, then the classifier will be able to distinguish between them. High distinguishability means that the data utility is low. In such a case the propensity score will be either 0 or 1, as illustrated in Figure 4-18.
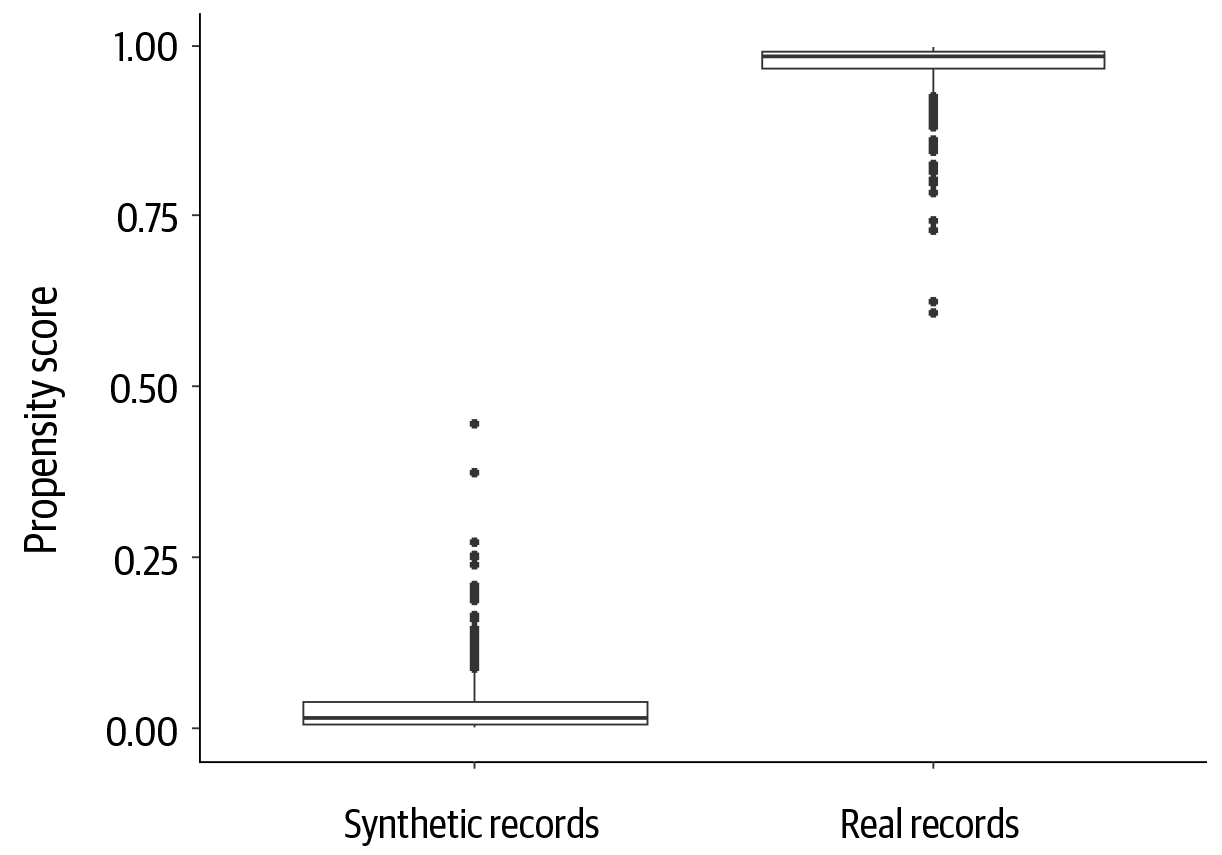
Figure 4-18. An example of distinguishability using propensity scores when there is almost a perfect difference between real and synthetic data
Of course, in reality, datasets will fall somewhere in between. We would not want them to be at either of these two extremes. Synthetic data that is difficult to distinguish from real data is considered to have relatively high utility.
We can also summarize this propensity score across all records. There are a few general methods that can be used for doing so (we call them the propensity score for synthesis, or PSS, 1 to 3):
- PSS1: computing the mean square difference between the propensity score and the 0.5 value
-
The 0.5 value is what the value would be if there were no difference between the real and synthetic data. It is also the expected value if labels were assigned randomly. Therefore, such a propensity mean square difference would have a value of 0 if the two datasets were the same, and a value of 0.25 if they were different.
- PSS2: converting the propensity score into a binary prediction
-
If the propensity score is greater than 0.5, predict that it is a real record. If the propensity score is less than 0.5, predict that it is a synthetic record. If the propensity score is 0.5, toss a coin. After that, compute the accuracy of these predictions. The accuracy will be closer to 1 if the two datasets are very different, which means that the classifier is able to distinguish perfectly between the real and synthetic data. The accuracy will be closer to 0.5 if the classifier is not able to distinguish between the two datasets.13
- PSS3: computing the mean square difference between the propensity score and the actual 0/1 label of a record
-
In such a case the difference will be 0 if the classifier is able to distinguish perfectly between the two datasets, and 0.25 if it is unable to distinguish between the datasets.
A summary of these different metrics is provided in Table 4-1.
| Type of metric | Datasets the same | Datasets different |
|---|---|---|
Mean square difference from 0.5 |
0 |
0.25 |
Accuracy of prediction |
0.5 |
1 |
Mean square difference from label |
0.25 |
0 |
In general we prefer to use the mean square difference from 0.5 or PSS1, but in practice all three methods will provide similar conclusions about data utility.
The comparison on the propensity score for the first trial indicates that generalized boosted models are not able to confidently distinguish the real data from the synthetic (see Figure 4-19). For the second trial, see Figure 4-20. In both cases the PSS1 scores are close to 0.1.
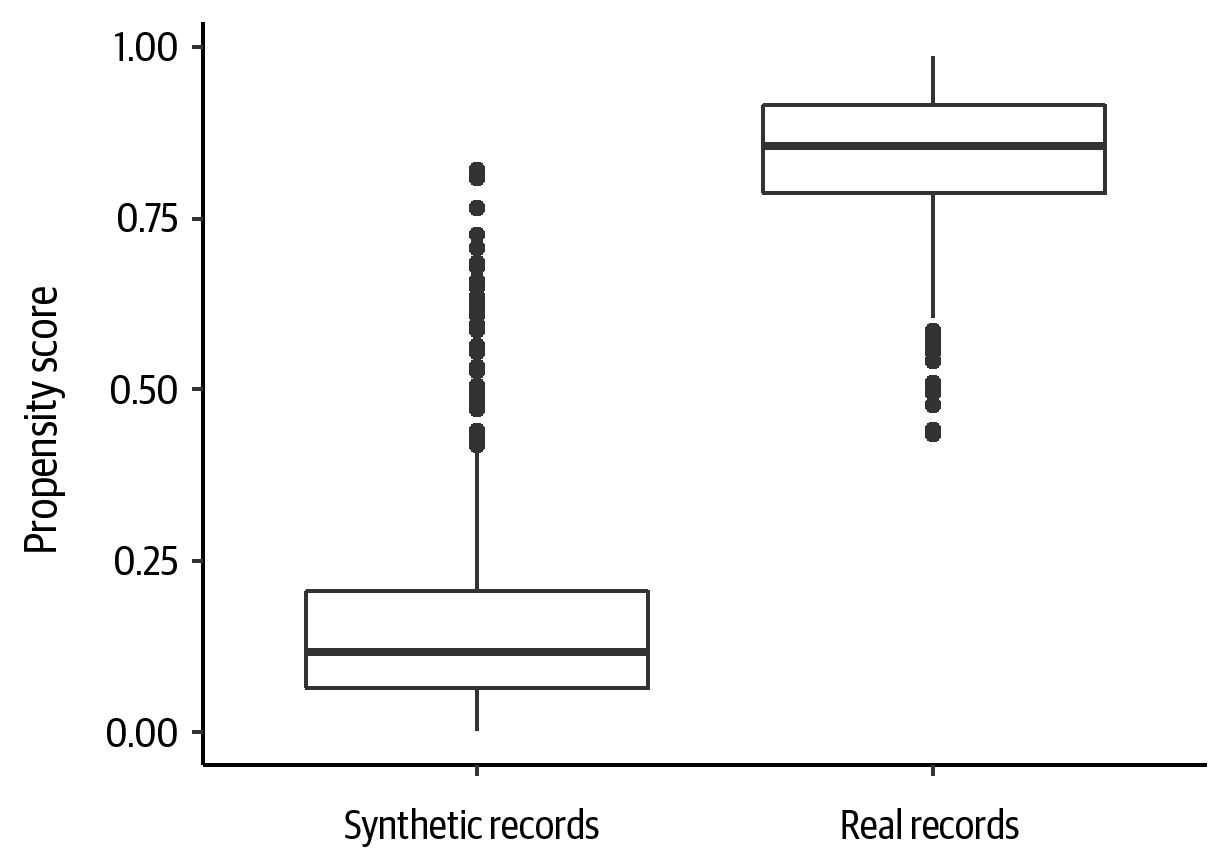
Figure 4-19. The propensity scores computed for the first trial, contrasting the values for real versus synthetic data
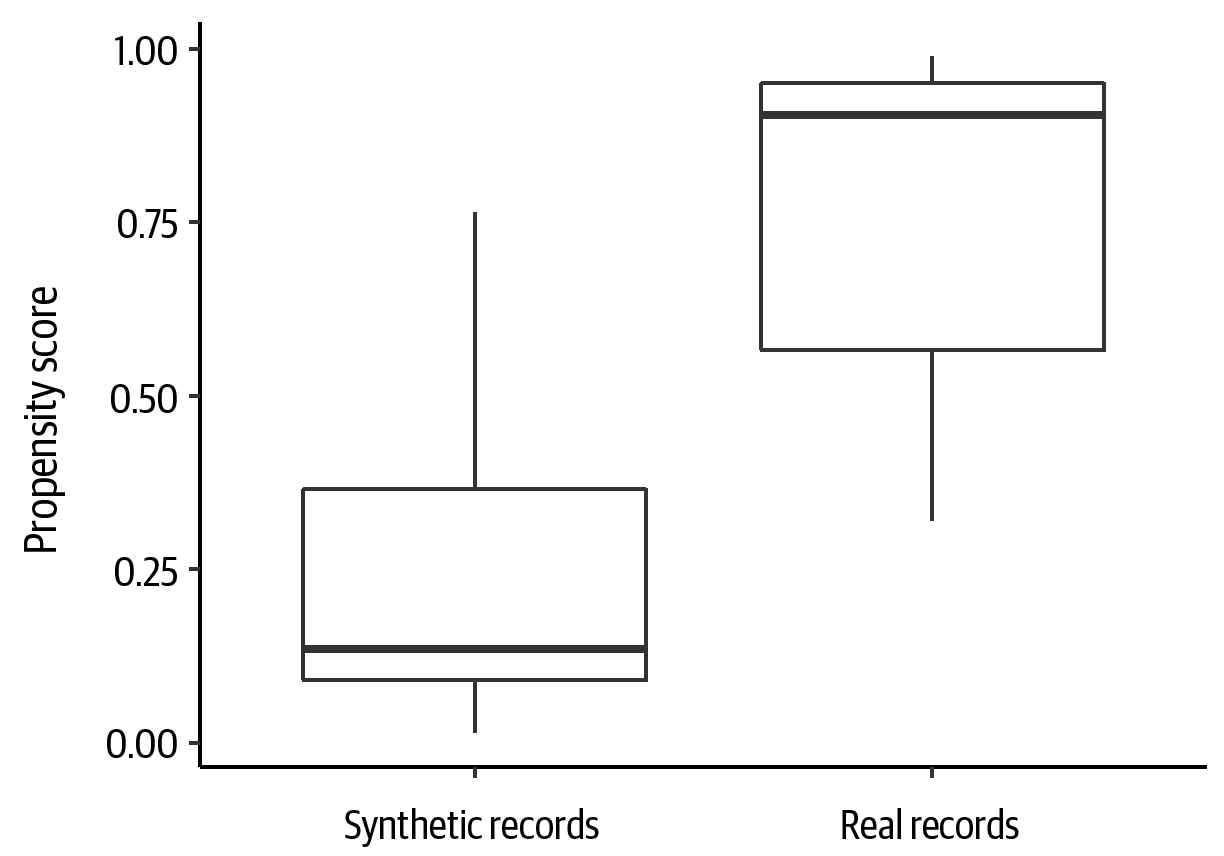
Figure 4-20. The propensity scores computed for the second trial, contrasting the values for real versus synthetic data
This result is a bit different than what we saw for the same datasets under the “all models” utility evaluation. That is not surprising because the utility tests are measuring different things. One possible explanation is as follows. The multivariate “all models” test selects the most important variables to build the model. It is plausible that variable importance varies between the real and synthetic datasets in these models but that the overall prediction is equivalent. In the PSS1 measure, the possibility that some variables are less/more important for some prediction tasks will be captured.
This highlights the importance of considering multiple utility metrics in order to get a broader appreciation of the utility of the dataset. Each method for assessing utility is covering a different dimension of utility that is complementary to the others.
We need a way to interpret these values. For example, is a PSS1 value of 0.1 good or bad?
One way to interpret the PSS1 score is to split the range into quintiles, as shown in Figure 4-21. We would ideally want the score to be at level 1, or at most at level 2, to ensure that the utility of the dataset is adequate. This also provides an easy-to-interpret approach to compare the distinguishability of different synthesis methods and datasets.
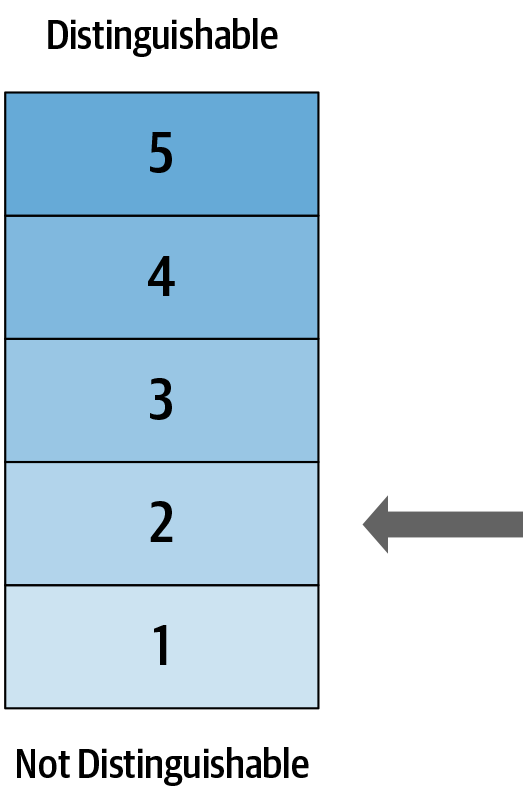
Figure 4-21. The PSS1 range can be split into quintiles, with a value closer to level 1 showing less distinguishability
Summary
The growing application and acceptance of synthetic data is evidenced by the plan to generate the heavily used general-purpose public tabulations from the US 2020 decennial census from synthetic data.14 A key question from synthetic data users is about its data utility. This chapter presented and demonstrated a framework to assess the utility of synthetic data, combining both generic and workload-aware measures.
A replicated analysis of a US census dataset showed that an original analysis could be replicated with high precision. This is an example of evaluating the utility when the eventual workload is known reasonably well in advance.
The utility analysis on two oncology trial datasets showed that by a variety of metrics, the synthetic datasets replicate the structure and distributions, as well as the bivariate and multivariate relationships of the real datasets reasonably well. While it uses only two studies, it does provide some initial evidence that it is possible to generate analytically useful synthetic clinical trial data. Such a framework can provide value for data users, data synthesizers, and researchers working on data synthesis methods.
The results of a utility assessment can be summarized in a dashboard, as in Figure 4-22. This gives in a single picture the key metrics on utility.
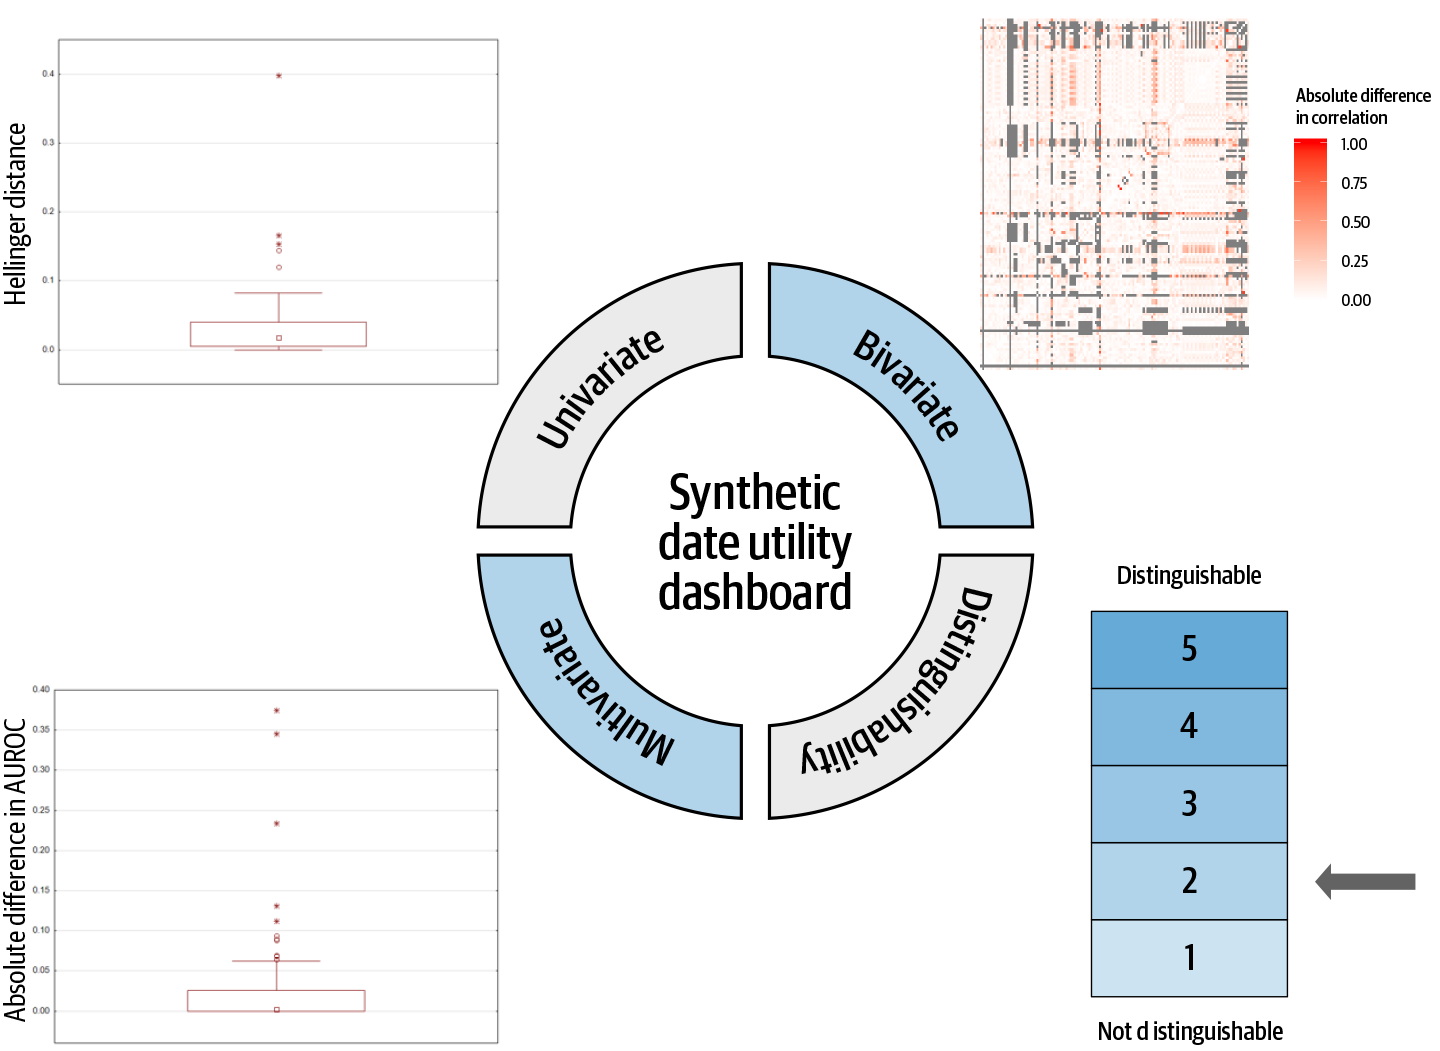
Figure 4-22. A dashboard summarizing the utility metrics for a synthetic dataset
In terms of limitations of the framework, we examined all variables and all models in our utility framework, then summarized across these. In practice, some of these variables or models may be more important than others, and will be driven by the question being addressed in the analysis. However, this framework still provides more meaningful results than generic data utility metrics, which would not reflect all workloads.
Note that in this chapter we focused on cross-sectional data. For longitudinal data, other types of utility metrics may be needed. This is a more complex topic because it is more dependent on the type of data (e.g., health data versus financial data).
In the next chapter, we examine in more detail how to generate synthetic data. Now that we know how to assess data utility, we can more easily compare alternative synthesis methods.
1 Jerome P. Reiter, “New Approaches to Data Dissemination: A Glimpse into the Future (?),” CHANCE 17, no. 3 (June 2004): 11–15.
2 Josep Domingo-Ferrer and Vicenç Torra, “Disclosure Control Methods and Information Loss for Microdata,” in Confidentiality, Disclosure, and Data Access: Theory and Practical Applications for Statistical Agencies, ed. Pat Doyle et al. (Amsterdam: Elsevier Science, 2001); Kristen LeFevre, David J. DeWitt, and Raghu Ramakrishnan, “Workload-Aware Anonymization,” in Proceedings of the 12th ACM SIGKDD International Conference on Knowledge Discovery and Data Mining (New York: Association for Computing Machinery, 2006): 277–286.
3 A. F. Karr et al., “A Framework for Evaluating the Utility of Data Altered to Protect Confidentiality,” The American Statistician 60, no. 3 (2006): 224–32.
4 Jerome P. Reiter, “Using CART to Generate Partially Synthetic Public Use Microdata,” Journal of Official Statistics 21, no. 3 (2005): 441–62.
5 Torsten Hothorn, Kurt Hornik, and Achim Zeileis, “Unbiased Recursive Partitioning: A Conditional Inference Framework,” Journal of Computational and Graphical Statistics 15, no. 3 (September 2006): 651–74.
6 Shanti Gomatam, Alan F. Karr, and Ashish P. Sanil, “Data Swapping as a Decision Problem,” Journal of Official Statistics 21, no. 4 (2005): 635–55.
7 Brett K. Beaulieu-Jones et al., “Privacy-Preserving Generative Deep Neural Networks Support Clinical Data Sharing,” bioRxiv (July 2017). https://doi.org/10.1101/159756; Bill Howe et al., “Synthetic Data for Social Good,” Cornell University arXiv Archive, October 2017. https://arxiv.org/abs/1710.08874; Ioannis Kaloskampis, “Synthetic Data for Public Good,” Office for National Statistics, February 2019. https://oreil.ly/qfVvR.
8 Margaret Sullivan Pepe, The Statistical Evaluation of Medical Tests for Classification and Prediction (Oxford: Oxford University Press, 2004).
9 Malika Charrad et al., “NbClust: An R Package for Determining the Relevant Number of Clusters in a Data Set,” Journal of Statistical Software 61, no. 6 (November 2014): 1–36.
10 Paul R. Rosenbaum and Donald B. Rubin, “The Central Role of the Propensity Score in Observational Studies for Causal Effects,” Biometrika 70, no. 1 (April 1983): 41–55.
11 Joshua Snoke et al., “General and Specific Utility Measures for Synthetic Data,” Journal of the Royal Statistical Society: Series A (Statistics in Society) 181, no. 3 (June 2018): 663–688.
12 Daniel F. McCaffrey et al., “A Tutorial on Propensity Score Estimation for Multiple Treatments Using Generalized Boosted Models,” Statistics in Medicine 32, no. 19 (2013): 3388–3414.
13 This metric is not suitable if the data is not balanced. For example, this will happen when the synthesized dataset is much larger than the real dataset.
14 Aref Dajani et al., “The Modernization of Statistical Disclosure Limitation at the U.S. Census Bureau” (presentation at the Census Scientific Advisory Committee meeting, Suitland, MD, September 2017).
Get Practical Synthetic Data Generation now with the O’Reilly learning platform.
O’Reilly members experience books, live events, courses curated by job role, and more from O’Reilly and nearly 200 top publishers.

