6. Technical Analysis for Quants
Technical analysis is a specific form of a timing screen. Technical analysis is the science (or art) of reading stock price charts and predicting what will happen next. Figure 6.1 shows an example of technical analysis from the Wikipedia entry on the subject.
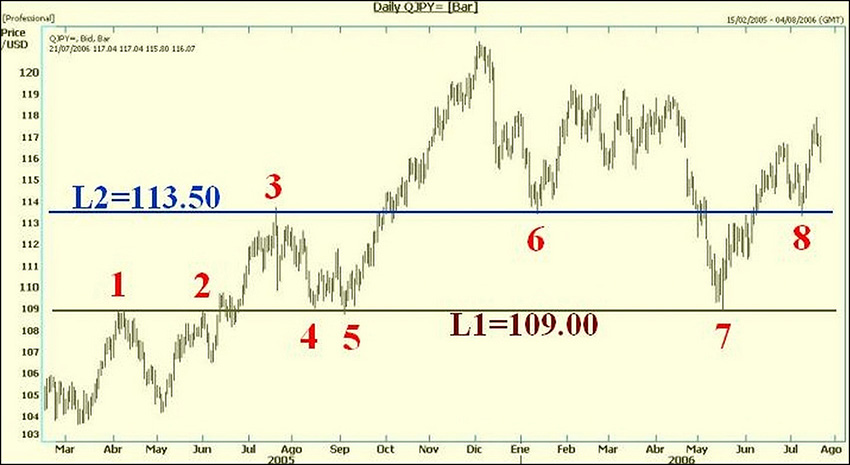
Figure 6.1 Technical analysis example (from Wikipedia)
This chart plots the price of the Japanese Yen against the U.S. dollar. The Wikipedia caption to the chart states, “Stock chart showing levels of support (4, 5, 6, 7, and 8) and resistance (1, 2, and 3); levels of resistance tend to become levels of support and vice versa.” The idea behind this piece ...
Get Principles of Quantitative Equity Investing: A Complete Guide to Creating, Evaluating, and Implementing Trading Strategies now with the O’Reilly learning platform.
O’Reilly members experience books, live events, courses curated by job role, and more from O’Reilly and nearly 200 top publishers.

